Producing

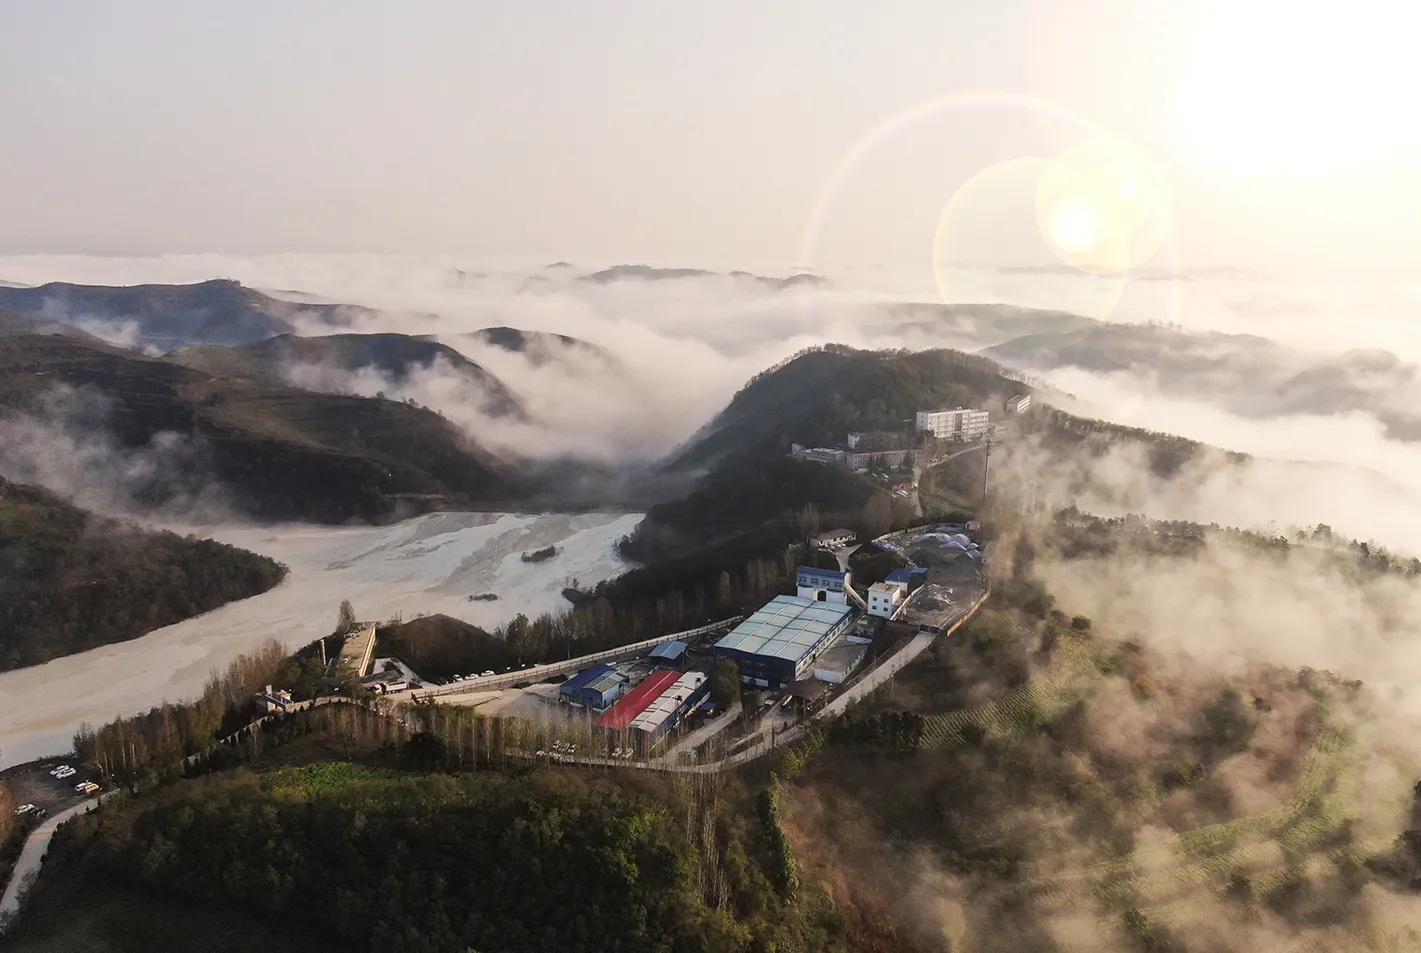
Ying Mining District

NEWONE2325555

Introduction

  • Seven underground mines (SGX, HZG, HPG, TLP, LME, LMW and DCG) and two processing plants (combined 2,500 tpd capacity)
  • Produces high-quality silver-lead and zinc concentrates and gold doré sold to smelters within the province
  • Located approximately 240 km west-southwest of Zhengzhou, the capital city of Henan Province, China, and 145 km southwest of Luoyang, the nearest major city
  • The 68.6 kmProperty is covered by four contiguous mining licenses:
    • Yuelianggou Mining License: SGX & HZG mines (19.8 km2)
    • Haopinggou Mining License: HPG mine (6.2 km2)
    • Tieluping-Longmen Mining License: TLP, LME and LMW mines (22.8 km2)
    • Dongcaogau Mining License: DCG Mine (19.8 km2)

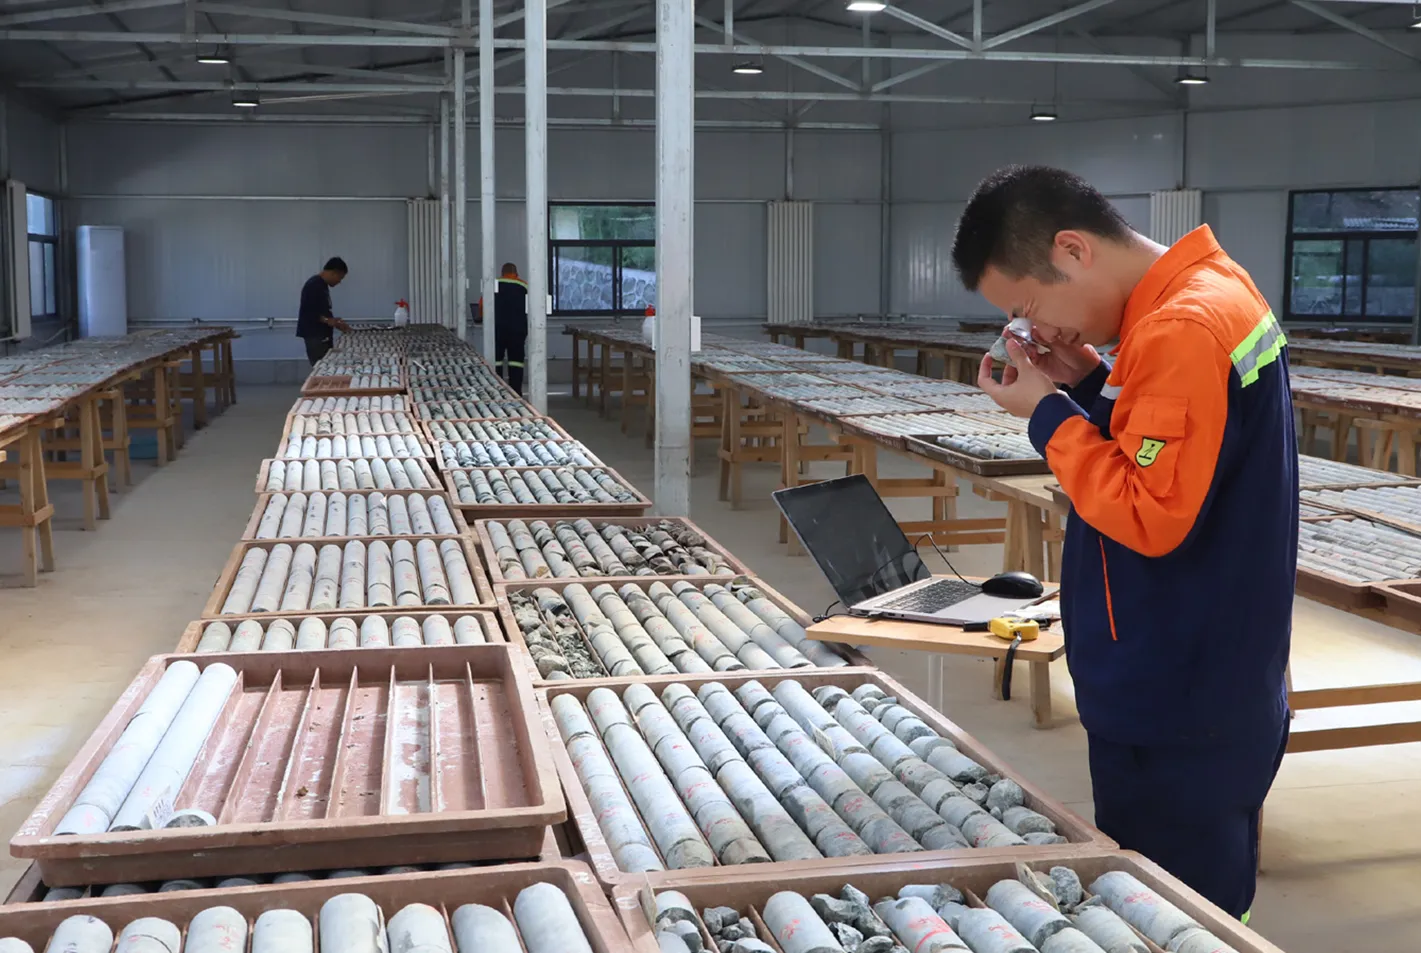
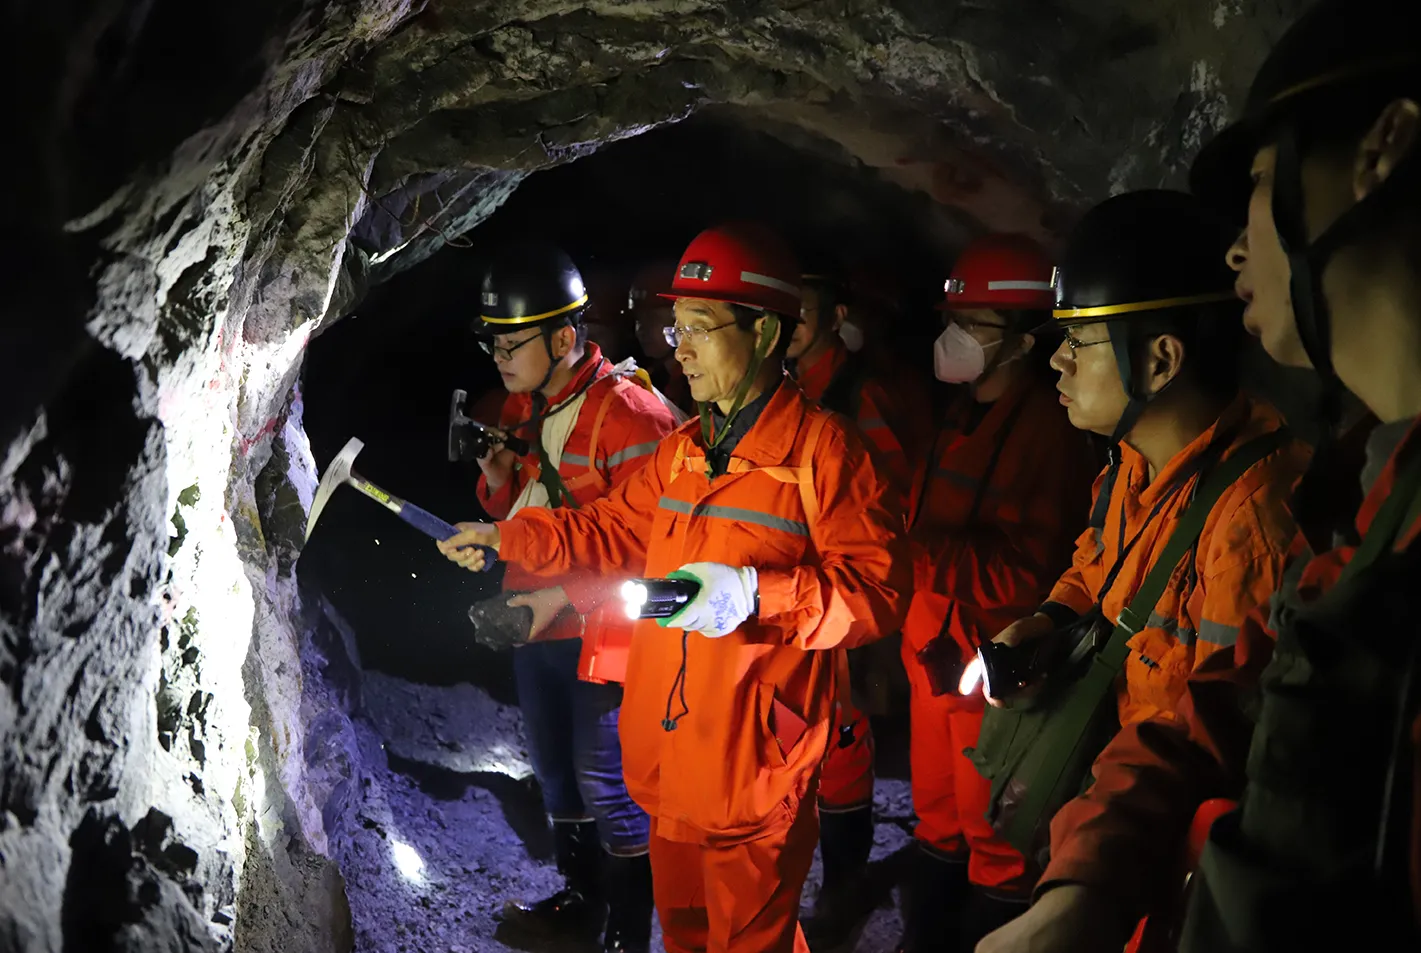
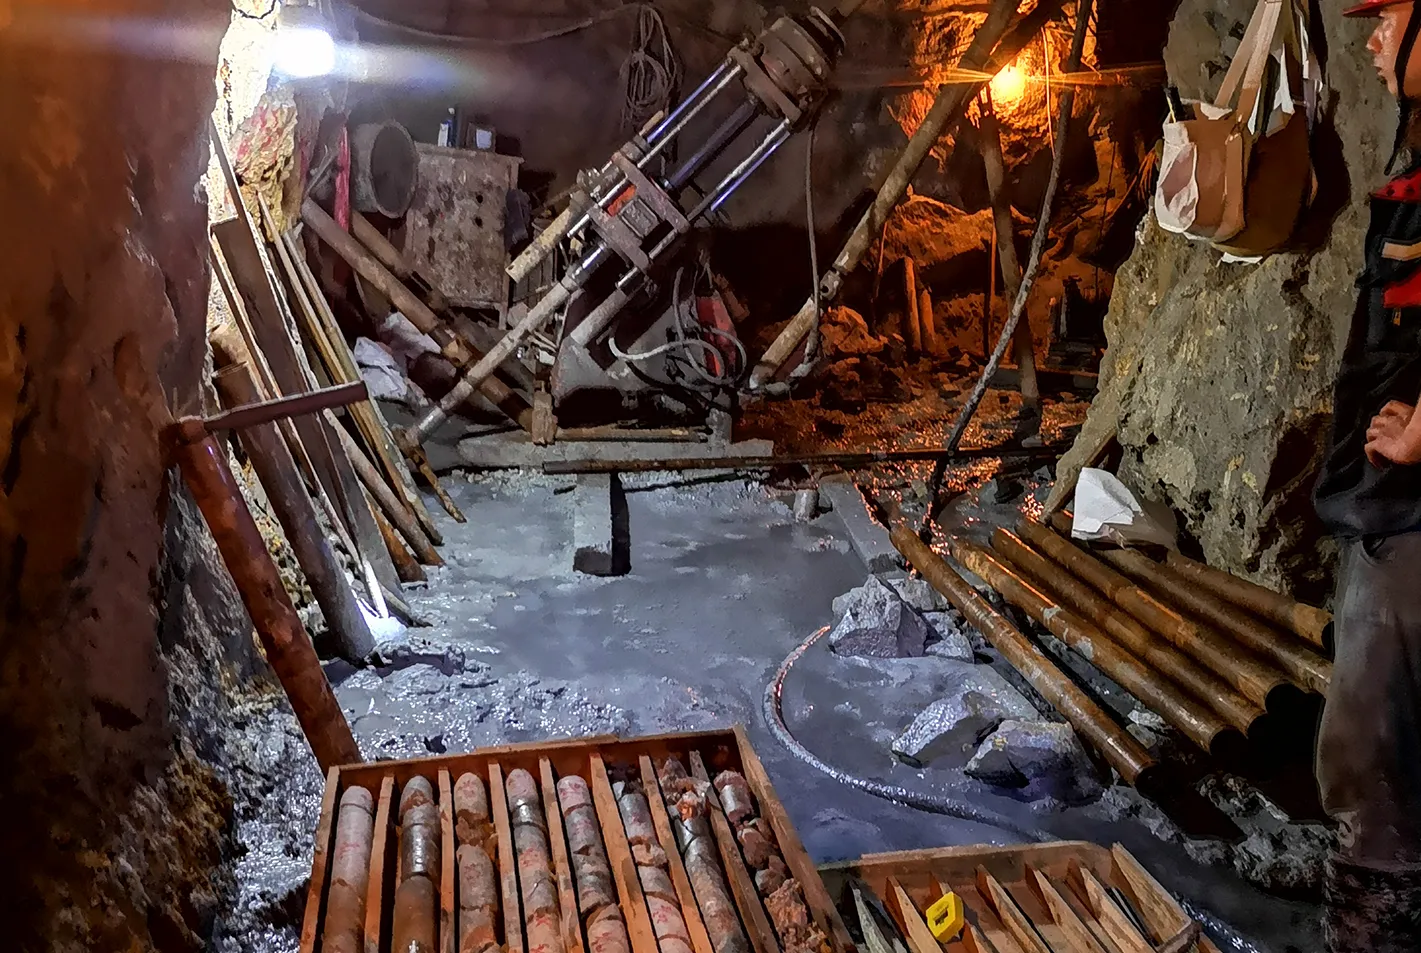
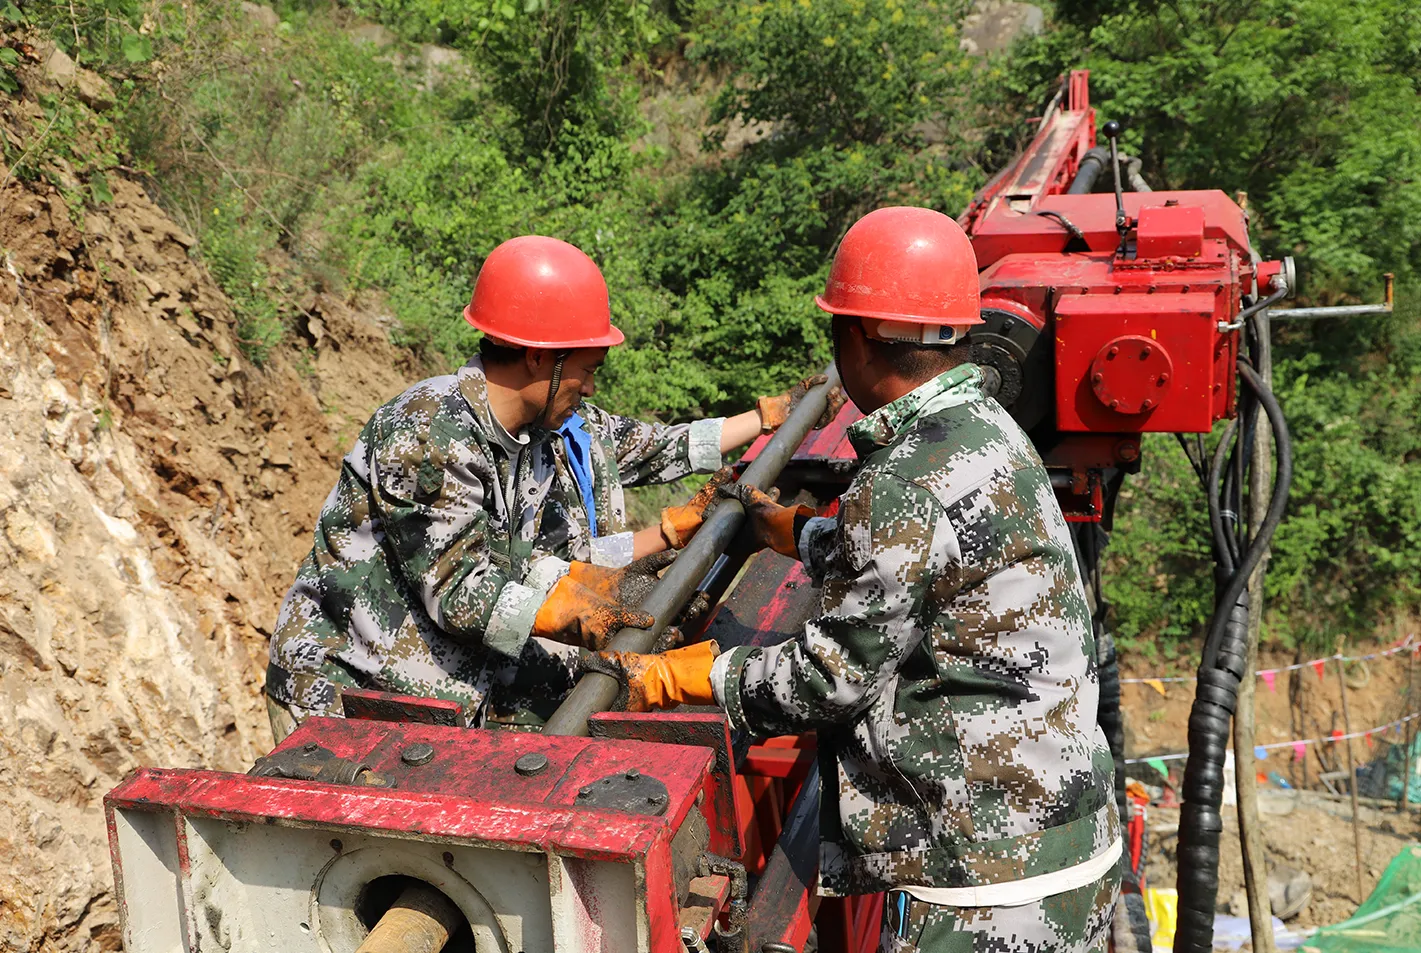
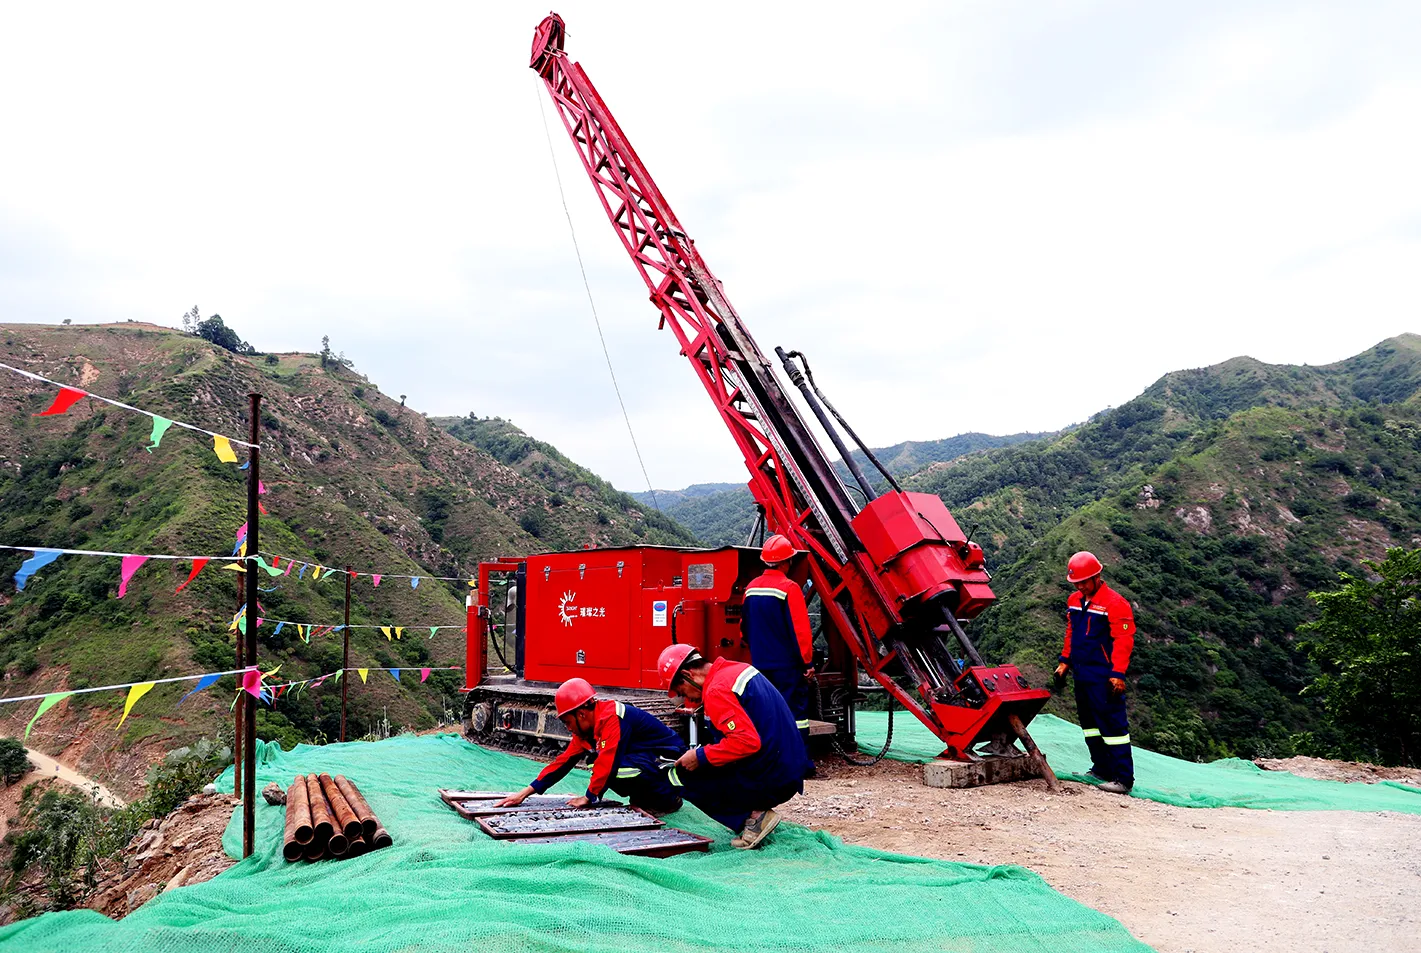
Exploration is an integral part of Silvercorp’s organic growth strategy at Ying. The Company completed over one million metres of drilling at and around the various mines from 2020 to 2023, which led to the discovery of new mineralization zones within the existing mining infrastructure. Land consolidation continued in 2021 with the successful acquisition of the neighboring Kuanping Project (KP), located 33 km north of Ying—further expanding the Company’s footprint within the prospective Qinling orogenic belt.


Multiple mine optimization and production expansion programs are currently underway to enhance operational efficiency and boost productivity. These low-capital-intensity, high-impact investments will further increase the Company's capacity, enabling it to continue growing its existing hub-and-spoke operations at Ying.

Operation Snapshot

Mine Life 1

15 Years

Silver Production

FY2022A: 5,509 koz
FY2023A: 6,024 koz
FY2024A: 5,677 koz

FY2025E: 6.2-6.7 Moz


AISC 2

FY2022A: US$147.52/t
FY2023A: US$146.59/t
FY2024A: US$141.82/t

FY2025E: US$142.3-$153.2/t

1 Ying Mining District Reserves and Resources update effective December 31, 2021.

2 AISC refers to all-in sustaining costs per tonne of ore processed.

Mineral Processing

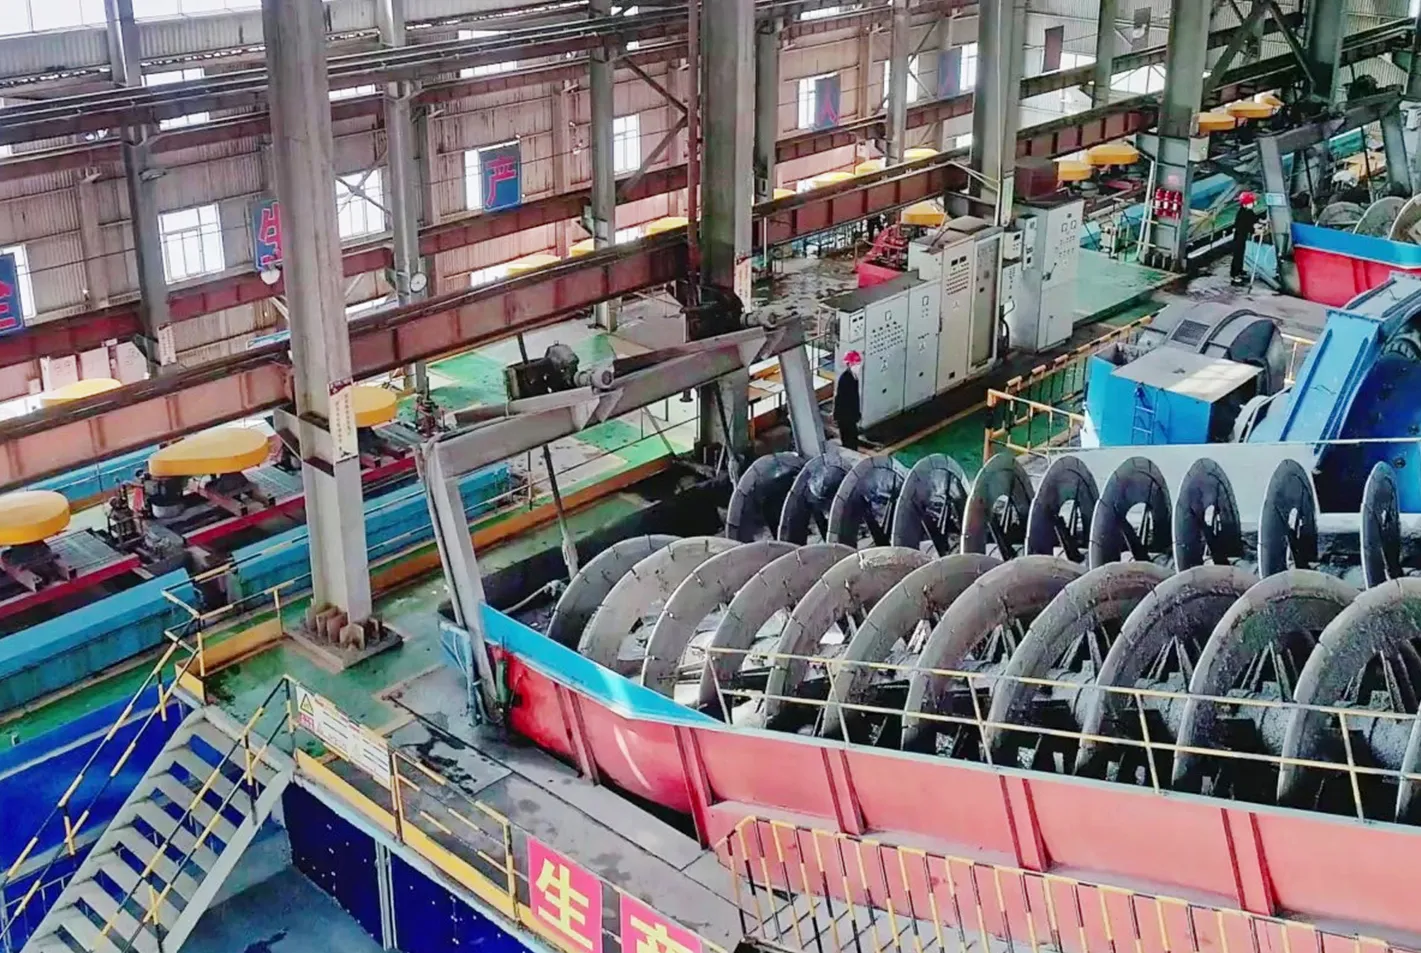
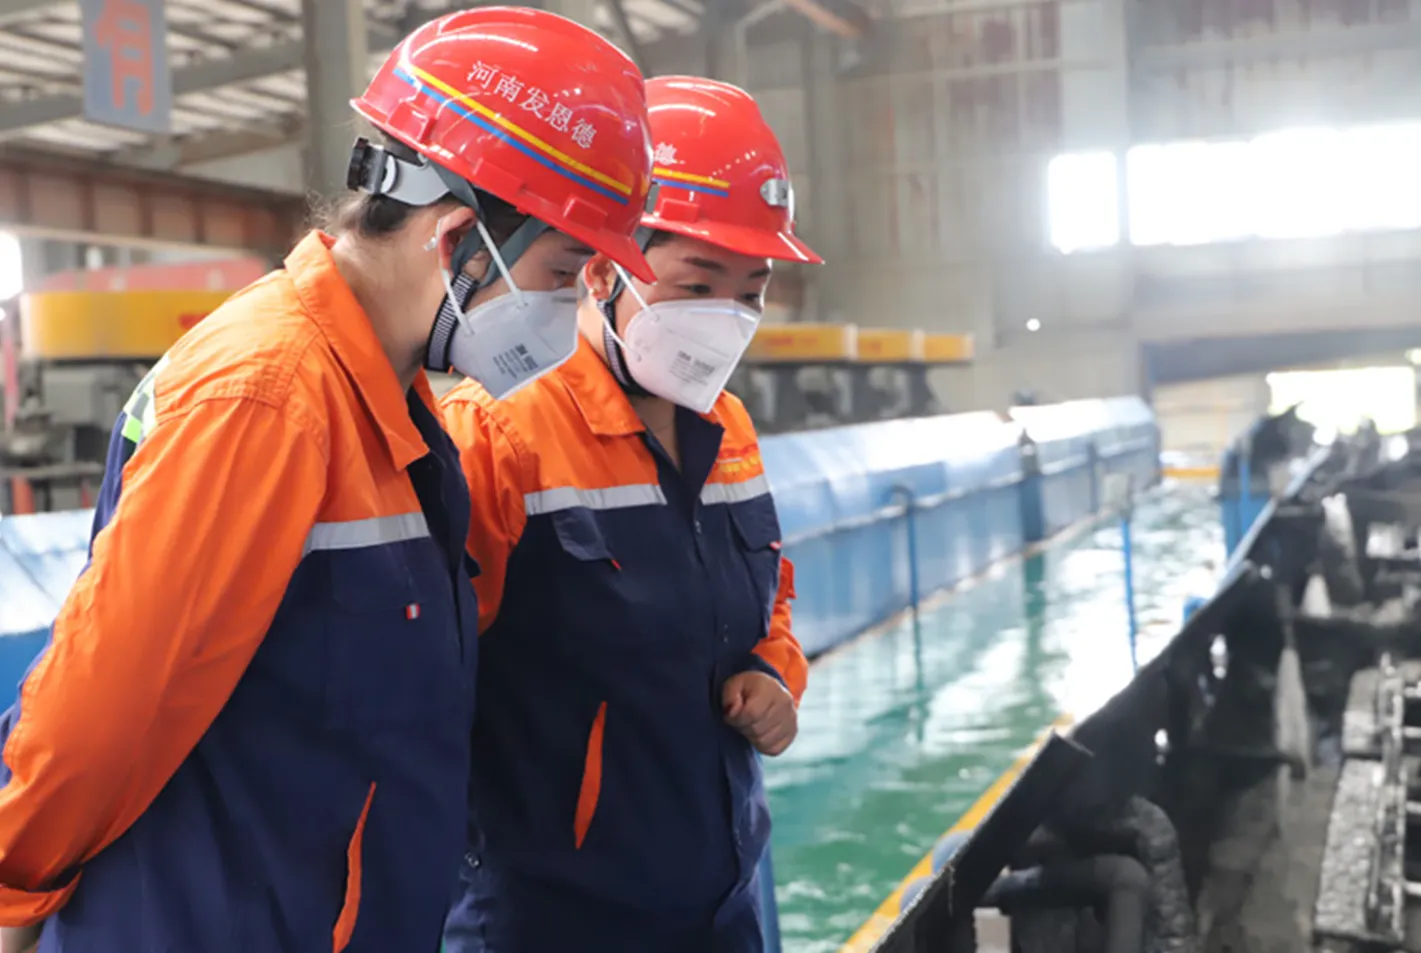
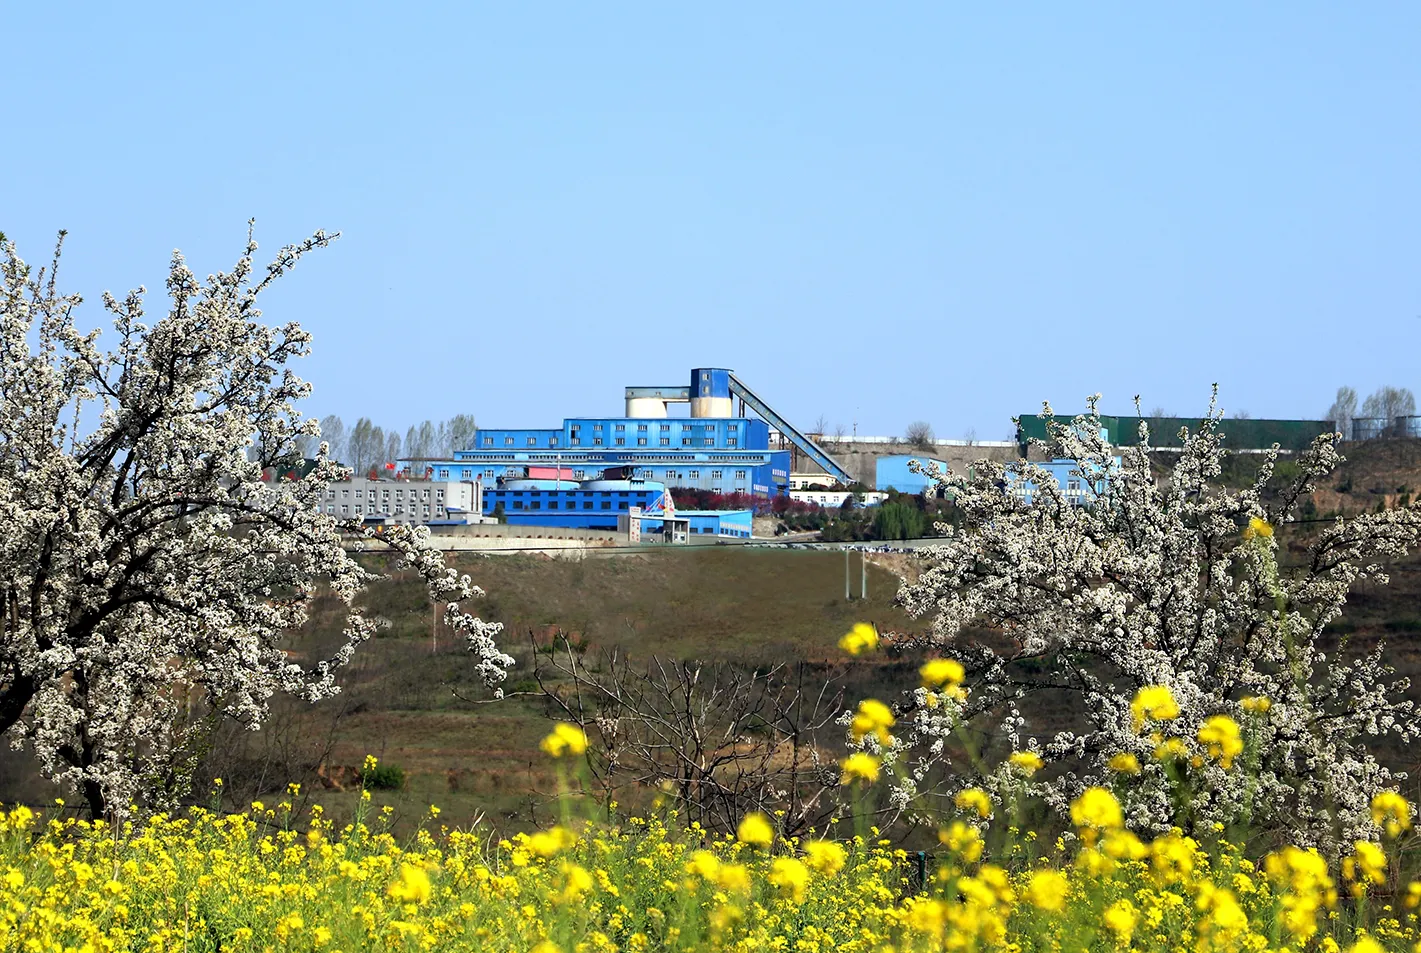
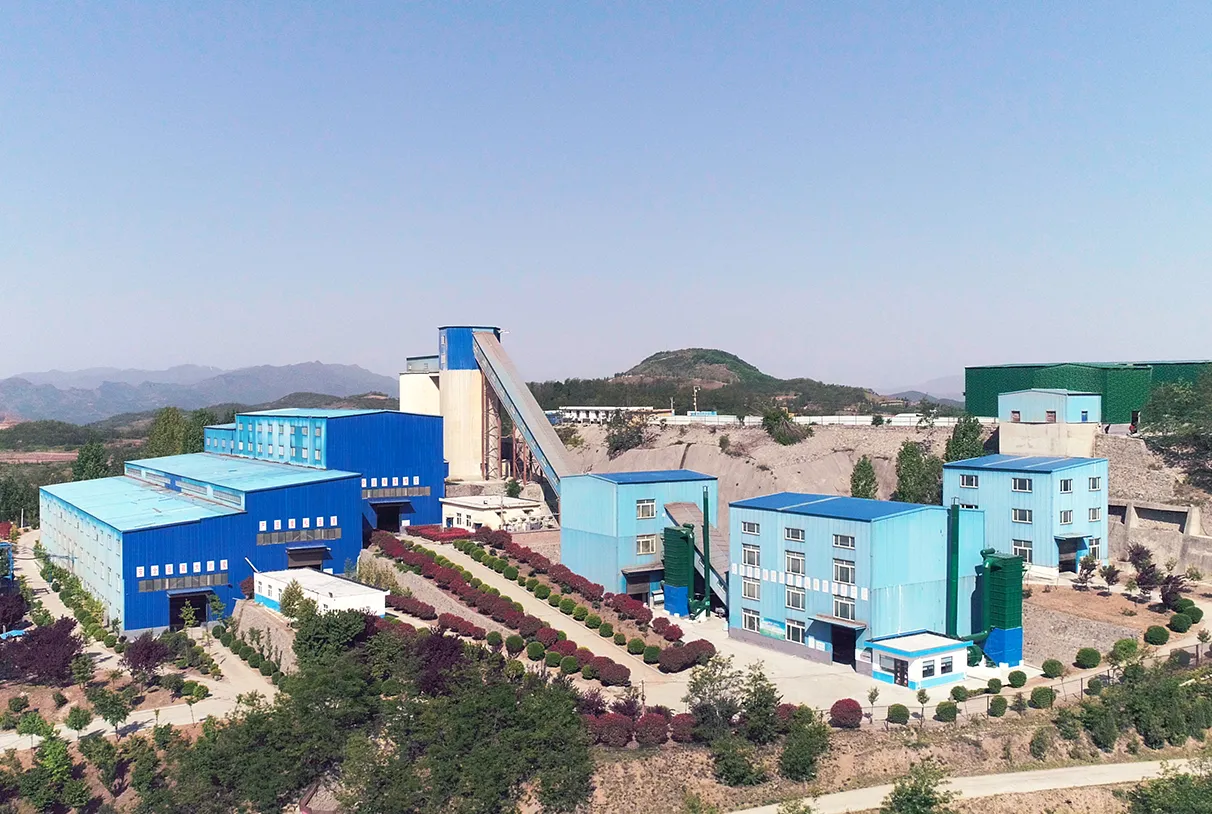
Silvercorp currently operates two sulphide flotation plants at Ying with a total design capacity of 2,500 tpd.

  • Mill No. 1 (Xiayu) has a design capacity of 700 tpd and has been in operation since March 2007
  • Mill No. 2 (Zhuangtou) has a design capacity of 1,800 tpd (expanded from 900 tpd in October 2011) and has been in operation since December 2009


Silvercorp is considering adding a new production line with a 1,500 tpd capacity at the No. 2 Mill, which will increase the processing capacity at the Ying Mining District to 4,000 tpd. The Company will provide additional details when available.


Construction of a new 19.1 million cubic meters tailings storage facility is on track for completion in 2024.

Exploration and Geology

Exploration Overview

  • All mines in the Ying Mining District have defined resources and reserves to support profitable operations for a decade or more
  • None of the mine areas have been fully explored or delimited
  • Each mine area hosts a plethora of known veins with mineralization open for expansion
  • Exploration drilling over the past two years also discovered new gold and gold-copper structures and broad gold-silver mineralization in a new rhyolitic breccia dyke
  • Further afield, several outlying target areas remain prospective for more discoveries
  • Essentially, there is no shortage of exploration targets in the district—and by leveraging existing mining infrastructure, these “low-hanging fruit” can be fast-tracked into development / production
  • In fiscal year 2025, Silvercorp plans to complete ~255,000 m of exploration drilling (capitalized and expensed) at Ying. The current drill program is complemented by ~45,800 m of exploration tunneling (capitalized)
  • Exploration strategy at Ying:
    • Drilling veins at shallower depths (closer to surface) where exploration remains limited
    • Drilling the newly discovered, low-angle gold and gold-copper structures at LMW and other areas
    • Step-out drilling from the resource area for new discoveries

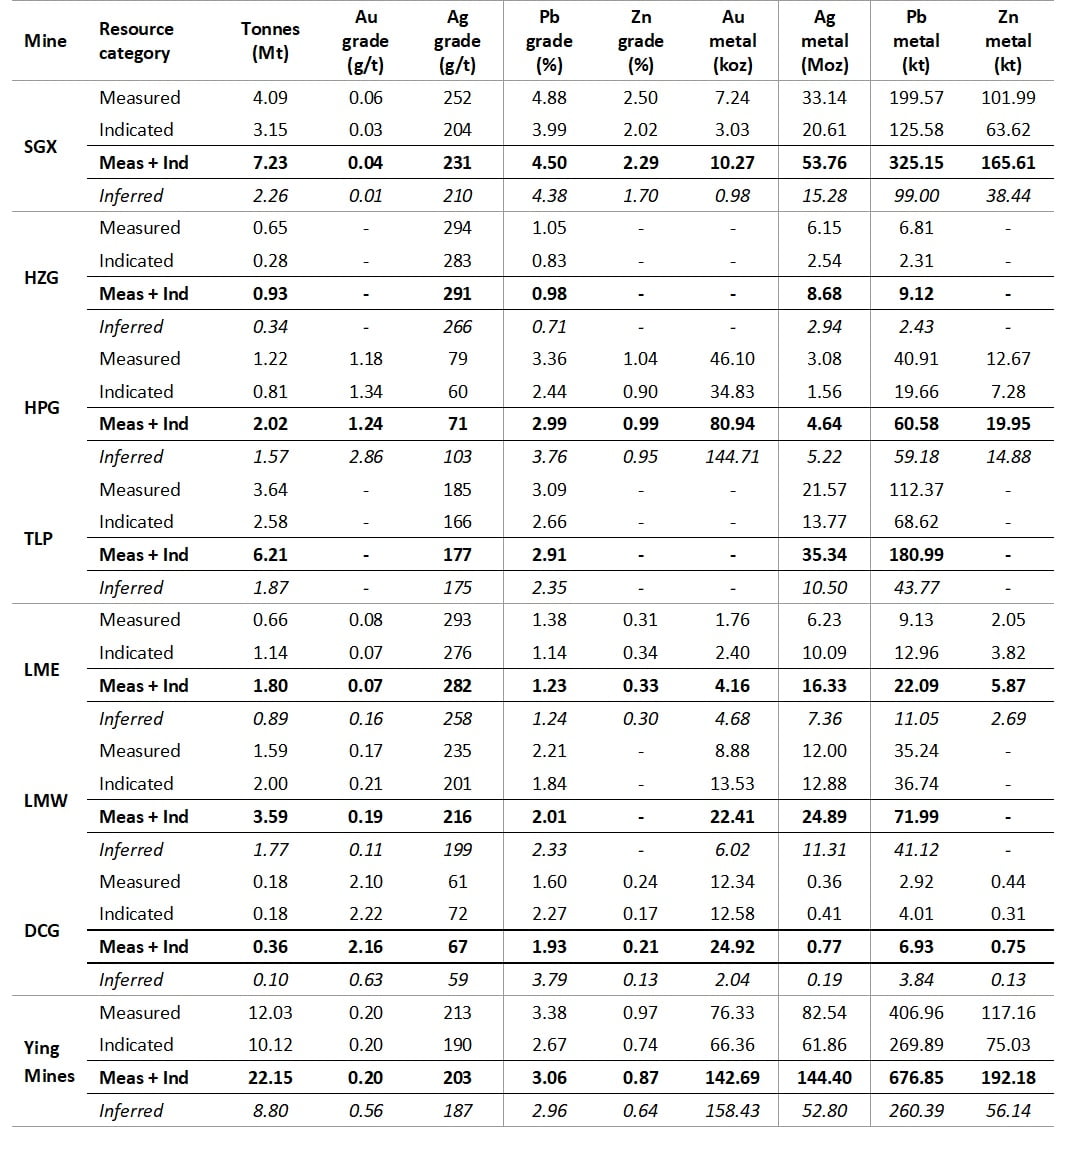
Ying Property - Mineral Resources and metal content for silver, lead, zinc, and gold as of 30 June, 2024 (Inclusive of Mineral Reserves)

R1

Notes:

  • CIM Definition Standards (2014) were used for reporting.
  • Measured and Indicated Mineral Resources are inclusive of Mineral Reserves.
  • Metal prices: gold US$1,800/troy oz, silver US$21.00/troy oz, lead US$1.00/lb, zinc US$1.10/lb.
  • Exchange rate: RMB 7.00: US$1.00.
  • Mineral Resources exclude the first 5 m below surface.
  • The Mineral Resource estimates for the SGX, TLP, and HZG mines were carried out by Silvercorp and reviewed by independent Qualified Person, Mr Simeon Robinson, P.Geo., MAIG of AMC, who takes responsibility for these estimates.
  • The Mineral Resource estimates for the LMW and LME mines were carried out by Silvercorp and reviewed by independent Qualified Person, Mr Justin Glanvill, Pri.Sci.Nat. of AMC, who takes responsibility for these estimates.
  • The Mineral Resource estimates for the HPG and DCG mines were carried out by Silvercorp and reviewed by independent Qualified Person, Dr Craig Stewart, P.Geo. of AMC, who takes responsibility for these estimates.
  • Veins factored to minimum extraction width of 0.4 m after estimation.
  • Cut Off Grades (COGs): SGX 140 g/t AgEq; HZG 130 g/t AgEq; HPG 140 g/t AgEq; TLP 125 g/t AgEq; LME 130 g/t AgEq; LMW 125 g/t AgEq; DCG 150 g/t AgEq.
  • AgEq equivalent formulas by mine:
    • SGX = Ag g/t+35.05*Pb%+17.97*Zn%.
    • HZG = Ag g/t+33.59*Pb%.
    • HPG = Ag g/t+80.6*Au g/t+35.17*Pb%+21.60*Zn%.
    • TLP = Ag g/t+33.23*Pb%.
    • LME = Ag g/t+32.71*Pb%+9.38*Zn%.
    • LMW = Ag g/t+34.20*Pb%.
    • DCG = Ag g/t+33.18*Pb%.
  • AgEq formulas used for significant gold bearing veins:
    • SGX (Veins S11, S16W_Au, S18E, S74) = Ag g/t+54.44*Au g/t+35.05*Pb%+17.97*Zn%.
    • LME (Veins LM4E2, LM4E3) = Ag g/t+55.12*Au g/t+32.71*Pb%+9.38*Zn%.
    • LMW (Veins LM21, LM22, LM26, LM28, LM50, LM50_3, LM52, LM53, LM54) = Ag g/t+71.85*Au g/t+34.2*Pb%.
    • DCG (Veins C76, C9_1, C9_2, C9_3, C9_4, C9E1, C9W1) = Ag g/t+83.44*Au g/t+33.18*Pb%
  • Includes assay results up to and including 31 December 2023.
  • Depleted for mine production to 30 June 2024. Non-recoverable Mineral Resources (sterile areas due to the proximity to stopes, unstable ground or where access to the vein is limited) defined as of 30 June 2024.
  • Numbers may not compute exactly due to rounding.
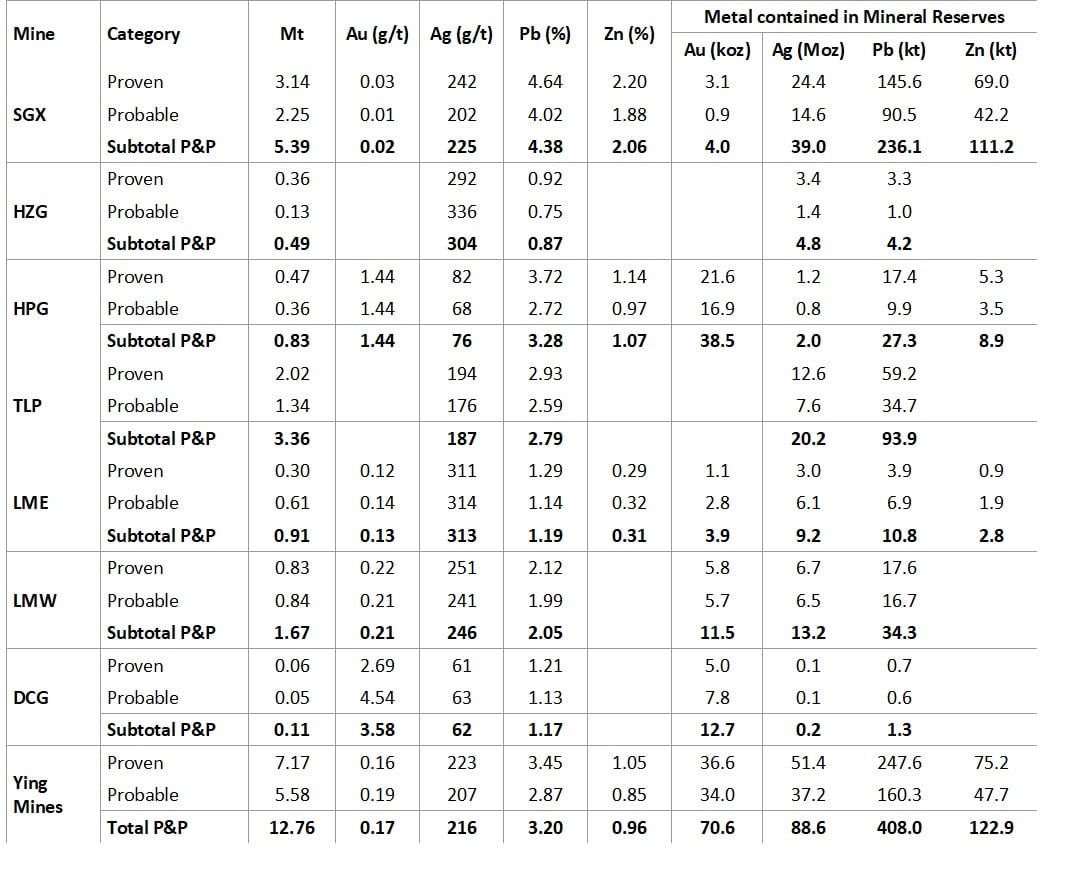
Ying Property - Mineral Reserves and metal content for silver, lead, zinc, and gold as of 30 June 2024

R2

Notes:

  • Cut‐off grades (AgEq g/t): SGX – 225 Resuing, 190 Shrinkage; HZG – 235 Resuing, 205 Shrinkage; HPG – 240 Resuing, 200 Shrinkage; TLP – 205 Resuing, 170 Shrinkage; LME – 235 Resuing, 210 Shrinkage, 205 Room & Pillar; LMW – 250 Resuing, 225 Shrinkage, 195 Longhole, 205 Room & Pillar; DCG – 275 Resuing, 235 Shrinkage.
  • Stope Marginal cut‐off grades (AgEq g/t): SGX – 200 Resuing, 160 Shrinkage; HZG – 195 Resuing, 165 Shrinkage; HPG – 220 Resuing, 180 Shrinkage; TLP – 185 Resuing, 160 Shrinkage; LME – 205 Resuing, 185 Shrinkage, 150 Room & Pillar; LMW ‑ 195 Resuing, 165 Shrinkage, 140 Longhole, 150 Room & Pillar; DCG – 235 Resuing, 190 Shrinkage.
  • Development Ore cut‐off grades (AgEq g/t): SGX – 125; HZG – 120; HPG – 145; TLP – 115; LME – 145; LMW – 125; DCG ‑ 150.
  • Unplanned dilution (zero grade) assumed as 0.05 m on each wall of a resuing stope and 0.10 m on each wall of a shrinkage stope. 20% unplanned dilution assumed for LMW longhole. 17% average dilution for Room & Pillar at LME, 33% average dilution for Room & Pillar at LMW.
  • Mining recovery factors assumed as 95% for resuing and 92% for shrinkage; for LMW longhole, 80% is assumed; for R&P at LME and LMW, 92% is assumed.
  • Metal prices: gold US$1,800/troy oz, silver US$21.00/troy oz, lead US$1.00/lb, zinc US$1.10/lb.
  • Processing recovery factors: SGX – 66.6% Au, 96.4% Ag, 97.6% Pb, 60.5% Zn; HZG – 96.4% Ag, 93.6% Pb; HPG ‑ 92.0% Au, 89.9% Ag, 91.4% Pb, 67.8% Zn; TLP – 94.0% Ag, 90.3% Pb; LME – 66.9% Au, 95.6% Ag, 90.4% Pb, 31.3% Zn; LMW – 88.3% Au, 96.8% Ag, 95.7% Pb; DCG – 85.7% Au, 80.9% Ag, 77.6% Pb.
  • Payables: Au – 85%; Ag – 92.5%; Pb – 98.0%; Zn – 73.7%.
  • Exclusive of mine production to 30 June 2024.
  • Exchange rate assumed is RMB 7.00 : US$1.00.
  • Numbers may not compute exactly due to rounding.
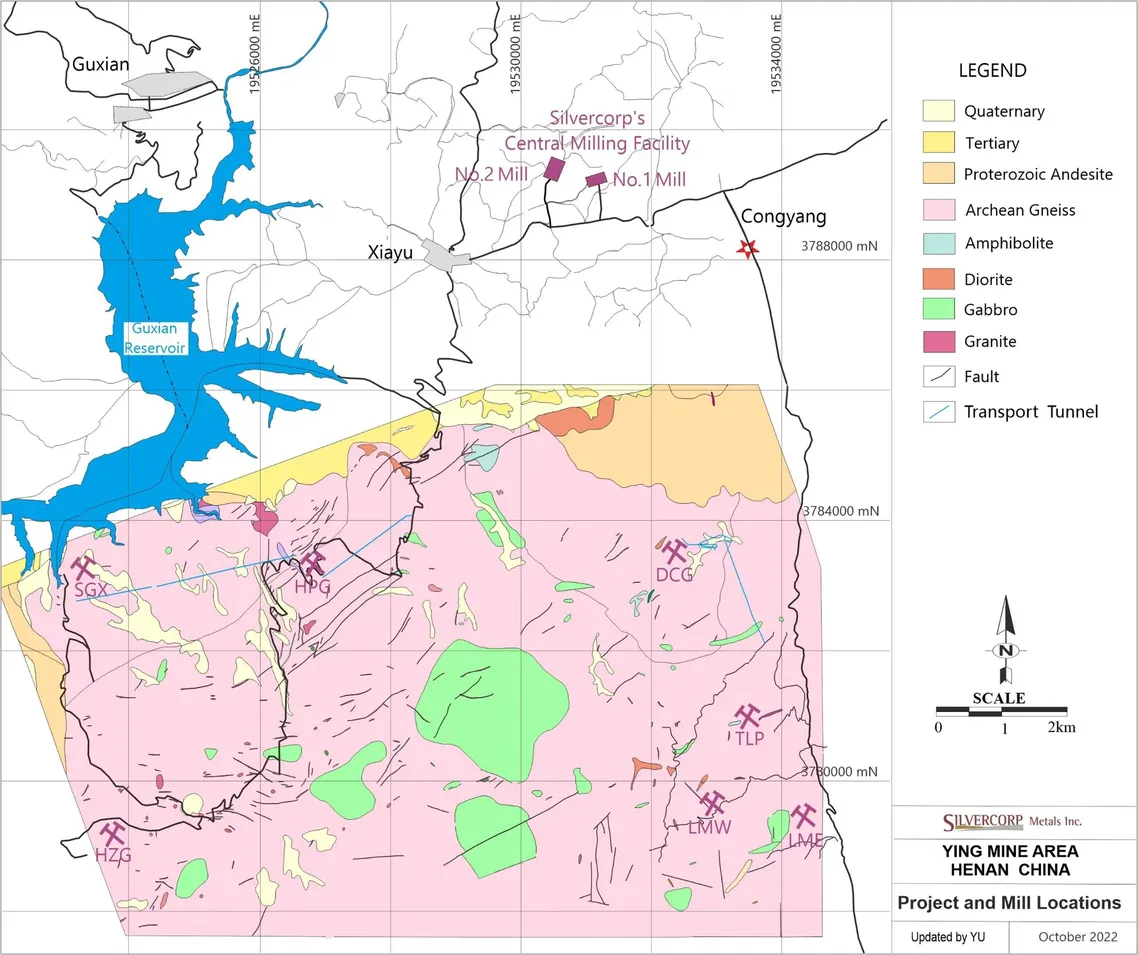
Ying Map

Geological Background

The Ying Property is located within the 300 km long west-northwest trending Qinling orogenic belt, a major structural corridor formed by the collision of two large continental tectonic plates in the Paleozoic. Rocks along the orogenic belt are heavily folded and faulted, offering optimal structural conditions for the emplacement of mineral deposits. Several operating silver-lead-zinc mines, including those on the Ying Property, occur along this belt. Dominant regional structures are west-northwest trending folds and faults. The faults consist of numerous thrusts that have a component of oblique movement with sets of conjugate shear structures trending either northwest or northeast. These conjugate shear zones are associated with known mineralization in the district.


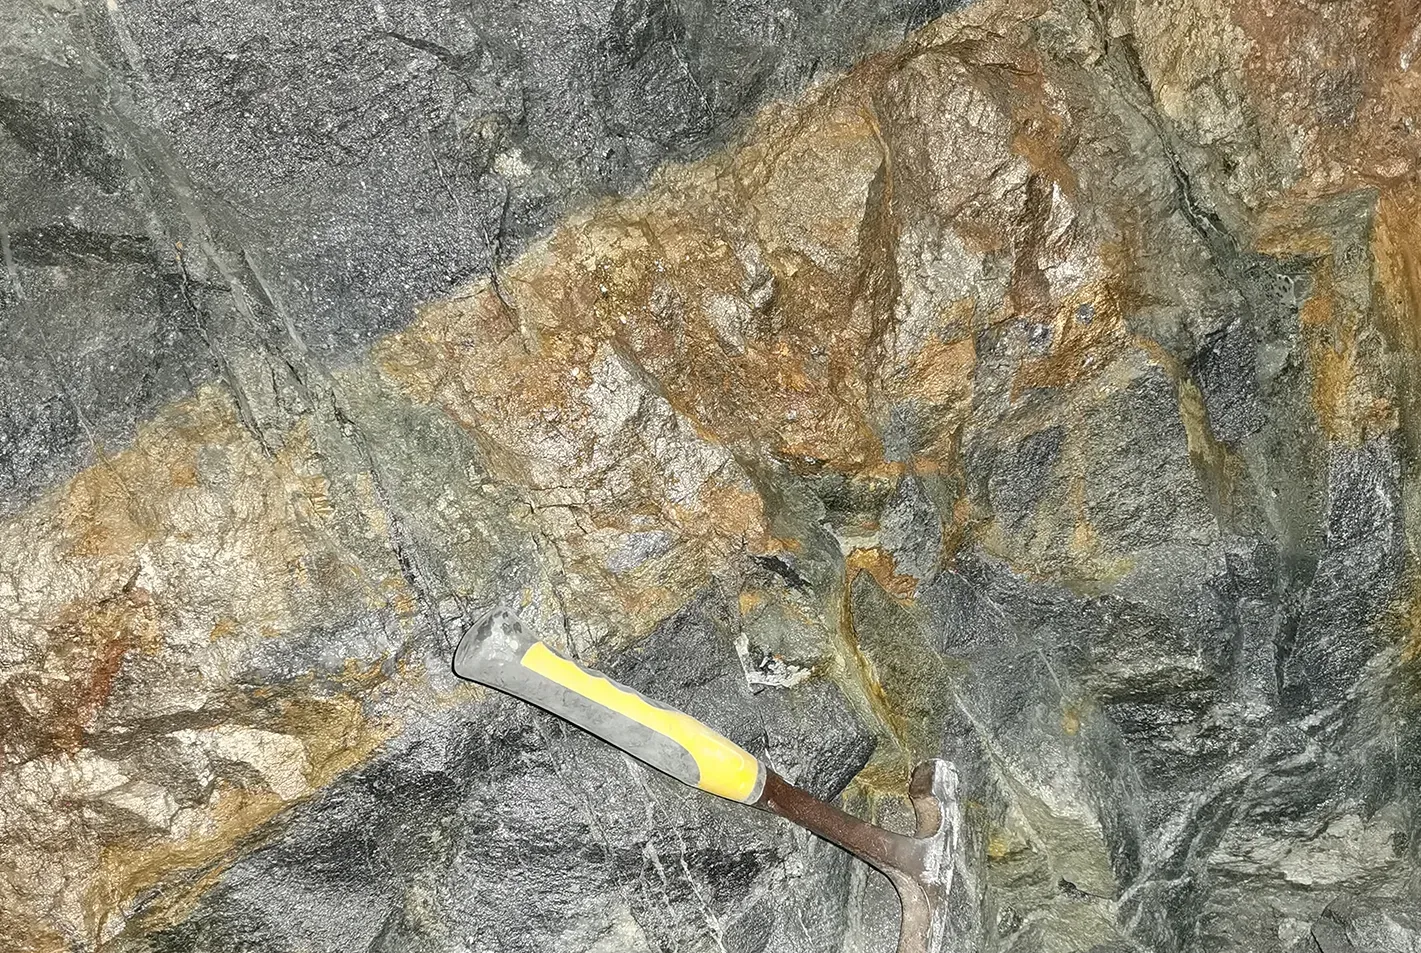
Structurally, mesothermal vein systems throughout the district are all somewhat similar in that they occur as sets of quartz-carbonate veins of generally similar orientation enclosed by steeply dipping fault-fissure zones, which trend most commonly northeast-southwest, less commonly north-south, and rarely northwest-southeast. The structures extend for hundreds to a few thousand metres along strike. The vein systems consist of narrow, tabular or splayed veins, often occurring as sets of parallel and offset veins. The veins thin and thicken abruptly along the structures in classic “pinch-and-swell” fashion, with widths varying from a few centimetres to a few metres. “Swells” in structural dilatant zones along the veins often form mineralized “shoots”. To date, significant mineralization has been defined or developed in over 300 discrete vein structures, and many other smaller veins have been found but remain unexplored.


The vein systems of the various mines in the district also share similar mineralogy, with slight documented differences between some of the separate mine areas and between the different vein systems within each area, attributed to district-scale mineral zonation at different levels of exposure. This subtle zonation is thought to be analogous to the broad-scale zonation patterns observed in the Coeur d’Alene District (USA) and characteristic of many other significant mesothermal silver-lead-zinc camps in the world.

Projects

  • Overview

  • Producing

    • Ying Mining District

    • GC Mine

  • Development

    • El Domo

  • Exploration

    • Condor

    • Other

  • Care & Maintenance

    • BYP

  • Technical Reports

  • Reserves & Resources

  • Enterprise Blog

Subscribe For Updates