VANCOUVER, British Columbia – February 4, 2021 – Silvercorp Metals Inc. (“Silvercorp” or the “Company”) (TSX/NYSE American: SVM) reported its financial and operating results for the third quarter ended December 31, 2020 (“Q3 Fiscal 2021”). All amounts are expressed in US Dollars.
Q3 FISCAL YEAR 2021 HIGHLIGHTS
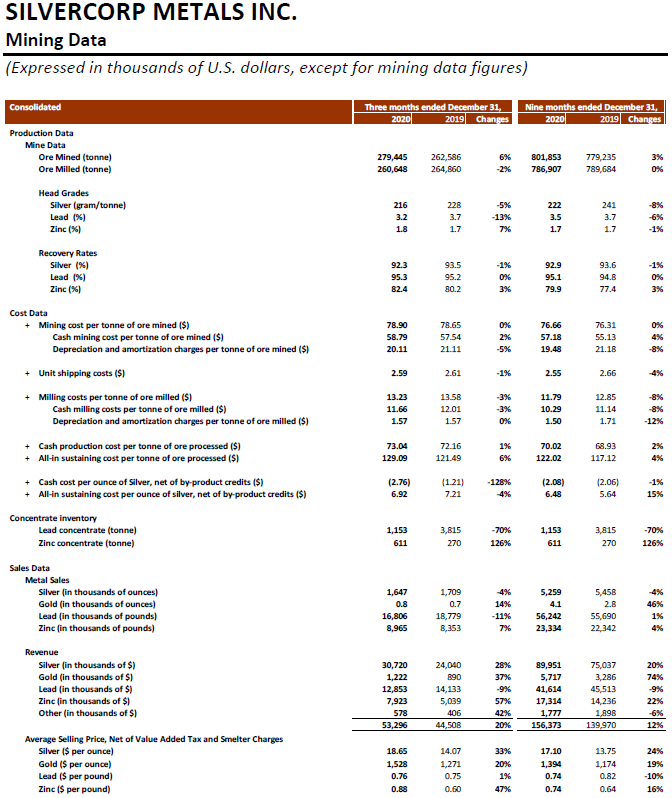
- Mined 279,445 tonnes of ore, up 6% compared to the prior year quarter, with ore milled of 260,648 tonnes, a decrease of 2% compared to the prior year quarter;
- Sold approximately 1.6 million ounces of silver, 800 ounces of gold, 16.8 million pounds of lead, and 9.0 million pounds of zinc, representing increases of 14% and 7% in gold and zinc sold and decreases of 4% and 11% in silver and lead sold compared to the prior year quarter;
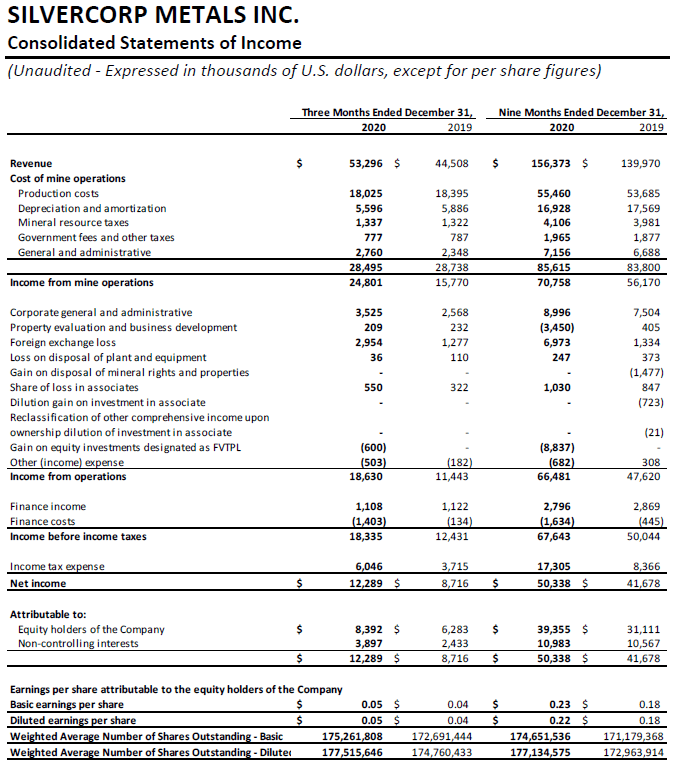
- Revenue of $53.3 million, up 20% or $8.8 million compared to $44.5 million in the prior year quarter;
- Net income attributable to equity shareholders of $8.4 million or $0.05 per share, up 33% compared to $6.3 million or $0.04 per share in the prior year quarter;
- Cash cost per ounce of silver, net of by-product credits, of negative $2.76, compared to negative $1.21 in the prior year quarter;
- All-in sustaining cost per ounce of silver, net of by-product credits, of $6.92, compared to $7.21 in the prior year quarter;
- Gain on equity investments of $0.6 million;
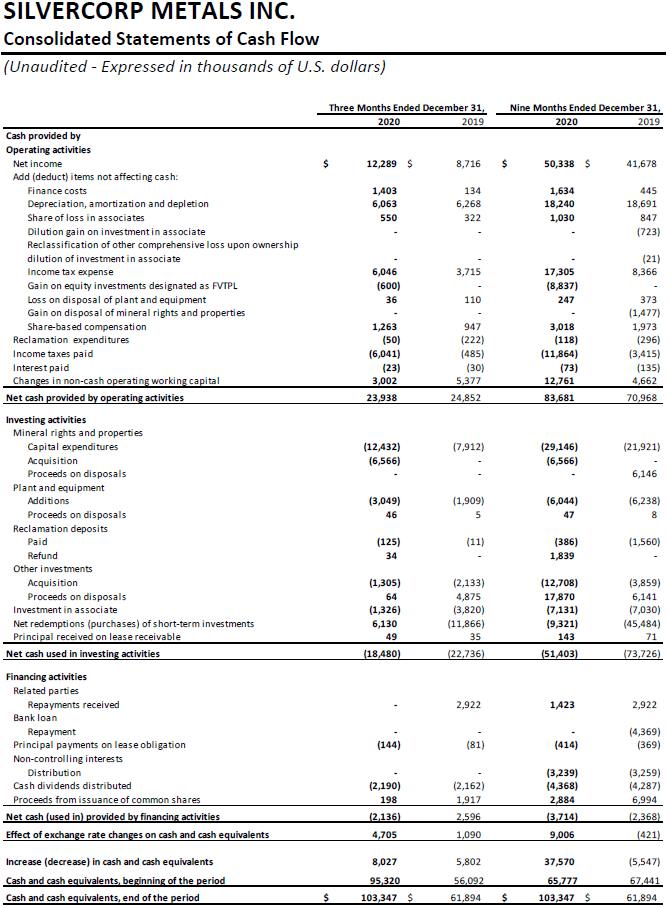
- Cash flow from operations of $23.9 million compared to $24.9 million in the prior year quarter;
- Paid dividends of $2.2 million, or $0.0125 per share, to equity shareholders;
- Acquired a 26.99% interest in Whitehorse Gold Corp. (“WHG”) at total cost of $1.3 million, having a fair market value of $35.5 million as at December 31, 2020, as result of (a) receiving 5,740,286 WHG common shares under a spin-out transaction completed by New Pacific Metals Corp. (“NUAG”), and (b) subscribing for 5,774,000 WHG common shares under a private placement;
- Won an online auction to acquire the exploration rights to the Zhonghe Silver Project from the Henan provincial government of China, with the mineral rights transfer contract pending the clearance of the project area as not being in a military area by the related authorities;
- Acquired a 45% interest in the La Yesca Silver Project in Mexico for approximately $7.6 million as announced on February 2, 2021;
- Investment in NUAG with a carrying value of $50.8 million and market value of $277.0 million and other investments of $18.8 million as at December 31,2020; and
- Strong balance sheet with $204.1 million in cash and cash equivalents and short-term investments, an increase of $4.0 million or 2% compared to $200.1 million as at September 30, 2020. This does not include the investments in associates and equity investments in other companies having a total market value of $331.3 million as at December 31, 2020.
FINANCIALS
Net income attributable to equity shareholders of the Company in Q3 Fiscal 2021 was $8.4 million, or $0.05 per share, up 33% compared to $6.3 million, or $0.04 per share in Q3 Fiscal 2020.
Compared to Q3 Fiscal 2020, the Company’s financial results in Q3 Fiscal 2021 were mainly impacted by the following: i) an increase of 33%, 20%, 1% and 47% in the net realized selling prices for silver, gold, lead and zinc; ii) an increase of 14% and 7% in the amount of gold and zinc sold, offset by i) a decrease of 4% and 11% in the amount of silver and lead sold; ii) a $3.0 million in foreign exchange loss, and iii) a $1.4 million finance costs.
Revenue in Q3 Fiscal 2021 was $53.3 million, up 20% or $8.8 million compared to $44.5 million in Q3 Fiscal 2020. The increase was mainly due to i) an increase of $10.5 million arising from the increase in the net realized selling prices for silver, gold, lead and zinc; ii) an increase of $0.7 million arising from the increase in the amount of gold and zinc sold; offset by iii) a decrease of $2.6 million arising from the decrease in the amount of silver and lead sold. Silver, gold and base metal sales represented $30.7 million, $1.2 million, and $21.4 million, respectively, compared to silver, gold and base metals sales of $24.0 million, $0.9 million, and $19.6 million, respectively, in Q3 Fiscal 2020. Revenue from the Ying Mining District in Q3 Fiscal 2021 was $42.5 million, up 19% compared to $35.7 million in Q3 Fiscal 2020. Revenue from the GC Mine in Q3 Fiscal 2021 was $10.8 million, up 22% compared to $8.8 million in Q3 Fiscal 2020.
Production costs expensed in Q3 Fiscal 2021 were $18.0 million, a decrease of $0.4 million, compared to $18.4 million in Q3 Fiscal 2020. The production costs expensed represent approximately 247,000 tonnes of ore processed and expensed at a cost of $73.04 per tonne, compared to approximately 255,000 tonnes at $72.16 per tonne in Q3 Fiscal 2020.
Income from mine operations in Q3 Fiscal 2021 was $24.8 million or 47% of revenue, compared to $15.8 million or 35% of revenue in Q3 Fiscal 2020. Income from mine operations at the Ying Mining District was $21.7 million or 51% of revenue, compared to $14.5 million or 41% of revenue in Q3 Fiscal 2020. Income from mine operations at the GC Mine was $3.3 million or 31% of revenue, compared to $1.4 million or 16% of revenue in Q3 Fiscal 2020.
General and administrative expenses in Q3 Fiscal 2021 were $6.3 million, an increase of $1.4 million compared to $4.9 million in Q3 Fiscal 2020. General and administrative expenses included corporate administrative expenses of $3.5 million (Q3 Fiscal 2020 – $2.6 million) and mine administrative expenses of $2.8 million (Q2 Fiscal 2020 – $2.3 million). The increase was mainly due to an increase of $0.7 million in salaries and benefits and $0.3 million in share-based compensation.
Foreign exchange loss in Q3 Fiscal 2021 was $3.0 million, an increase of $1.7 million compared to $1.3 million in Q3 Fiscal 2020. The foreign exchange loss is mainly driven by the appreciation of the Canadian dollar against the US dollar.
Share of loss in associates in Q3 Fiscal 2021 was $0.6 million (Q3 Fiscal 2020 – $0.3 million), representing the Company’s equity share of the loss in NUAG and WHG.
Gain on equity investments recorded in profit in Q3 Fiscal 2021 was $0.6 million, compared to $nil in Q3 Fiscal 2020.
Income tax expenses in Q3 Fiscal 2021 was $6.0 million, compared to $3.7 million in Q3 Fiscal 2020. The income tax expenses comprised of current income tax expenses of $4.5 million (Q3 Fiscal 2020 – $2.8 million) and deferred income tax expenses of $1.5 million (Q3 Fiscal 2020 – $0.9 million). The increase was mainly due to an increase of $9.0 million in income from mine operations.
Cash flow provided by operating activities in Q3 Fiscal 2021 was $23.9 million, a decrease of $1.0 million, compared to $24.9 million in Q3 Fiscal 2020. The decrease was mainly due to i) higher income taxes paid; ii) a negative impact from the change in non-cash working capital, offset by iii) higher operating income.
For the nine months ended December 31, 2020, net income attributable to equity shareholders of the Company was $39.4 million or $0.23 per share, an increase of $8.2 million, compared to $31.1 million or $0.18 per share in the same prior year period; revenue was $156.4 million, up 12% or $16.4 million, compared to $140.0 million in the same prior year period; income from mine operations was $70.8 million or 45% of revenue, compared to $56.2 million or 40% of revenue in the same prior year period; gain on equity investments recorded in profit was $8.8 million compared to $nil in the same prior year period; foreign exchange loss was $7.0 million compared to $1.3 million in the same prior year period; and cash flow from operating activities was $83.7 million, up 18% from $71.0 million in the same prior year period.
The Company ended the period with $204.1 million in cash and short-term investments, an increase of $4.0 million or 2% compared to $200.1 million as at September 30, 2020; and an increase of $61.6 million or 43% compared to $142.5 million as at March 31, 2020.
Working capital as at December 31, 2020 was $168.7 million, an increase of $38.4 million or 29%, compared to $130.4 million as at March 31, 2020.
OPERATIONS AND DEVELOPMENT
(i) Q3 Fiscal 2021 vs. Q3 Fiscal 2020
In Q3 Fiscal 2021, on a consolidated basis, the Company mined 279,445 tonnes of ore, up 6% or 16,859 tonnes compared to 262,586 tonnes in the three months ended December 31, 2019 (“Q3 Fiscal 2020”). Ore milled was 260,648 tonnes, a decrease of 2% or 4,212 tonnes, compared to 264,860 tonnes in Q3 Fiscal 2020. The decrease was mainly due to a 7% decrease in the ore milled at the Ying Mining District caused by power rationing in December 2020, as the local government is subject to an annual environmental emissions KPI assessment.
In Q3 Fiscal 2021, the Company sold approximately 1.6 million ounces of silver, 800 ounces of gold, 16.8 million pounds of lead, and 9.0 million pounds of zinc, an increase of 14% and 7% in gold and zinc sold, and a decrease of 4% and 11% in silver and lead sold, compared to 1.7 million ounces of silver, 700 ounces of gold, 18.8 million pounds of lead, and 8.4 million pounds of zinc in Q3 Fiscal 2020.
In Q3 Fiscal 2021, the consolidated total mining and cash mining costs were $78.90 and $58.79 per tonne, up 0% and 2% compared to $78.65 and $57.54 per tonne, respectively, in Q3 Fiscal 2020. The increase in per tonne cash mining cost was mainly due to an increase of $0.4 million in labour costs and $0.9 million in mining contractor costs.
The consolidated total milling and cash milling costs in Q3 Fiscal 2021 were $13.23 and $11.66 per tonne, down 3% and 3% compared to $13.58 and $12.01 per tonne, respectively, in Q3 Fiscal 2020. The decrease in per tonne cash milling cost was mainly due to a decrease of $0.2 million in mill administration costs.
Correspondingly, the consolidated cash production cost per tonne of ore processed in Q3 Fiscal 2021 was $73.04, up 1% compared to $72.16 in Q3 Fiscal 2020. The consolidated all-in sustaining production cost per tonne of ore processed was $129.09, up 6% compared to $121.49 in Q3 Fiscal 2020, but within the Company’s annual cost guidance. The increase in all-in sustaining production cost per tonne was mainly due to an increase of $1.4 million in mine and corporate general and administrative expenses and a $0.3 million increase in sustaining capital expenditures.
In Q3 Fiscal 2021, the consolidated cash cost per ounce of silver, net of by-product credits, was negative $2.76, compared to negative $1.21, in Q3 Fiscal 2020. The decrease in cash cost per ounce of silver, net of by-product credits, was mainly due to an increase of $2.1 million in by-product sales, offset by an increase of 1% in per tonne production costs.
In Q3 Fiscal 2021, the consolidated all-in sustaining cost per ounce of silver, net of by-product credits, was $6.92 compared to $7.21 in Q3 Fiscal 2020. The decrease was mainly due to the decrease in cash cost per ounce of silver, net of by-product credits as discussed above offset by an increase of $0.3 million in sustaining capital expenditures.
In Q3 Fiscal 2021, on a consolidated basis, approximately 74,070 metres or $1.8 million worth of diamond drilling (Q3 Fiscal 2020 – 32,948 metres or $1.1 million) and 10,624 metres or $3.8 million worth of preparation tunnelling (Q3 Fiscal 2020 – 11,656 metres or $3.1 million) were completed and expensed as mining preparation costs. In addition, approximately 24,916 metres or $1.0 million of surface diamond drilling (Q3 Fiscal 2020 – nil) and 21,829 metres or $9.4 million worth of horizontal tunnels, raises, ramps and declines (Q3 Fiscal 2020 – 20,107 metres or $7.1 million) were completed and capitalized.
(ii) Nine months ended December 31, 2020 vs. nine months ended December 31, 2019
For the nine months ended December 31, 2020, on a consolidated basis, the Company mined 801,853 tonnes of ore, up 3% or 22,618 tonnes, compared to 779,235 tonnes mined in the same prior year period. Ore milled was 786,907 tonnes, a slight decrease of 2,777 tonnes, compared to 789,684 tonnes in the same prior year period.
The Company sold approximately 5.3 million ounces of silver, 4,100 ounces of gold, 56.2 million pounds of lead, and 23.3 million pounds of zinc, an increase of 46%, 1%, and 4% in gold, lead, and zinc sold, and a decrease of 4% in silver sold, compared to 5.5 million ounces of silver, 2,800 ounces of gold, 55.7 million pounds of lead, and 22.3 million pounds of zinc sold in the same prior year period.
For the nine months ended December 31, 2020, the consolidated total mining costs and cash mining costs were $76.66 and $57.18 per tonne, respectively, compared to $76.31 and $55.13 per tonne in the same prior year period. The increase in per tonne cash mining cost was mainly due to i) an increase of $0.4 million in labour costs, ii) an increase of $0.6 million in raw material costs and iii) an increase of $1.3 million in mining contractor costs.
For the nine months ended December 31, 2020, the consolidated total milling cost and cash milling cost were $11.79 and $10.29, respectively, compared to $12.85 and $11.14 per tonne in the same prior year period.
Correspondingly, the consolidated cash production cost per tonne of ore processed for the nine months ended December 31, 2020 was $70.02, up 2% compared to $68.93 in the same prior year period. The all-in sustaining production cost per tonne of ore processed was $122.02, up 4% compared to $117.12 in the same prior year period. The increase was mainly due to the increase in per tonne cash mining costs as discussed above and an increase of $1.0 million in sustaining capital expenditures.
For the nine months ended December 31, 2020, the consolidated cash cost per ounce of silver, net of by-product credits, was negative $2.08, compared to negative $2.06 in the same prior year period. The consolidated all-in sustaining cost per ounce of silver, net of by-product credits was $6.48 compared to $5.64 in the same prior year period. The increase was mainly due to i) an increase of 2% in per tonne production costs; ii) an increase of $1.0 million in sustaining capital expenditures; and iii) a decrease of 4% in silver sold.
For the nine months ended December 31, 2020, on a consolidated basis, approximately 154,748 metres or $4.2 million worth of diamond drilling (same prior year period – 93,544 metres or $3.0 million) and 27,622 metres or $7.4 million worth of preparation tunnelling (same prior year period – 37,224 metres or $9.6 million) were completed and expensed as mining preparation costs. In addition, approximately 63,400 metres or $2.9 million worth of surface diamond drilling (same prior year period – nil) and 74,418 metres or $26.7 million worth of horizontal tunnels, raises, ramps and declines (same prior year period – 63,736 metres or $22.0 million) were completed and capitalized.
1. Ying Mining District, Henan Province, China
(i) Q3 Fiscal 2021 vs. Q3 Fiscal 2020
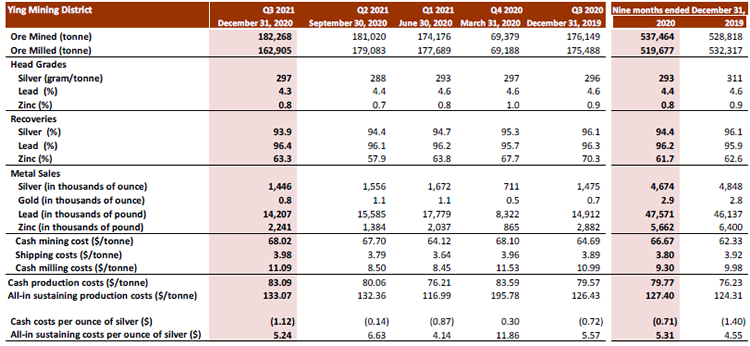
In Q3 Fiscal 2021, the total ore mined at the Ying Mining District was 182,268 tonnes, up 3% or 6,119 tonnes compared to 176,149 tonnes in Q3 Fiscal 2020. Ore milled was 162,905 tonnes, a decrease of 7% compared to 175,488 tonnes in Q3 Fiscal 2020. The decrease in ore milled was mainly a result of the milling operations being temporarily suspended for seven days due to power rationing in December 2020 as the local government is subject to an annual environmental emissions KPI assessment.
Head grades were 297 grams per tonne (“g/t”) for silver, 4.3% for lead, and 0.8% for zinc, compared to 296 g/t for silver, 4.6% for lead, and 0.9% for zinc in Q3 Fiscal 2020.
In Q3 Fiscal 2021, the Ying Mining District sold approximately 1.4 million ounces of silver, 800 ounces of gold, 14.2 million pounds of lead, and 2.2 million pounds of zinc, compared to 1.5 million ounces of silver, 700 ounces of gold, 14.9 million pounds of lead, and 2.9 million pounds of zinc in Q3 Fiscal 2020.
Total and cash mining costs per tonne at the Ying Mining District in Q3 Fiscal 2021 were $94.03 and $68.02 per tonne, respectively, compared to $91.91 and $64.69 per tonne in Q3 Fiscal 2020. The increase in the per tonne cash mining cost was mainly due to an increase of $0.2 million in labour costs and $0.6 million in mining contractor costs.
Total and cash milling costs per tonne at the Ying Mining District in Q3 Fiscal 2021 were $12.94 and $11.09, respectively, compared to $12.76 and $10.99 in Q3 Fiscal 2020. The slight increase in per tonne milling costs was mainly due to less ore milled resulting in higher fixed costs allocation.
Correspondingly, the cash production cost per tonne of ore processed in Q3 Fiscal 2021 at the Ying Mining District was $83.09, compared to $79.57 in Q3 Fiscal 2020. The all-in sustaining production cost per tonne of ore processed was $133.07, up 5% compared to $126.43 in Q3 Fiscal 2020, but below the Company’s annual cost guidance. The increase was mainly due to the increase in per tonne cash production costs as discussed above.
In Q3 Fiscal 2021, the cash cost per ounce of silver, net of by-product credits, at the Ying Mining District was negative $1.12 compared to negative $0.72 in Q3 Fiscal 2020. All-in sustaining cost per ounce of silver, net of by-product credits, was $5.24 compared to $5.57 in Q3 Fiscal 2020. The decrease was mainly due to an increase of $0.2 million in by-product sales, offset by a decrease of 2% in silver sold.
In Q3 Fiscal 2021, approximately 57,401 metres or $1.2 million worth of diamond drilling (Q3 Fiscal 2020 – 22,576 metres or $0.7 million) and 6,623 metres or $2.8 million worth of preparation tunnelling (Q3 Fiscal 2020 – 5,329 metres or $1.8 million) were completed and expensed as mining preparation costs at the Ying Mining District. In addition, approximately 24,916 metres or $1.0 million worth of surface diamond drilling (Q3 Fiscal 2020 – nil) and 19,014 metres or $8.3 million worth of horizontal tunnels, raises, ramps and declines (Q3 Fiscal 2020 – 22,105 metres or $10.5 million) were completed and capitalized.
(ii) Nine months ended December 31, 2020 vs. nine months ended December 31, 2019
For the nine months ended December 31, 2020, a total of 537,464 tonnes of ore were mined at the Ying Mining District, up 2% or 8,646 tonnes compared to 528,818 tonnes in the same prior year period. Ore milled was 519,677 tonnes, down 2% compared to 532,317 tonnes in the same prior year period. Average head grades of ore processed were 293 g/t for silver, 4.4% for lead, and 0.8% for zinc compared to 311 g/t for silver, 4.6% for lead, and 0.9% for zinc, in the same prior year period.
During the same time period, the Ying Mining District sold approximately 4.7 million ounces of silver, 2,900 ounces of gold, 47.6 million pounds of lead, and 5.7 million pounds of zinc, compared to 4.8 million ounces of silver, 2,800 ounces of gold, 46.1 million pounds of lead, and 6.4 million pounds of zinc in the same prior year period.
For the nine months ended December 31, 2020, the cash mining cost at the Ying Mining District was $66.67 per tonne, up 7% compared to $62.33 in the same prior year period. The increase in the per tonne cash mining cost was mainly due to an increase of $1.3 million in mining contractor’s costs. The cash milling cost was $9.30 per tonne, a decrease of 7% compared to $9.98 in the same prior year period.
Correspondingly, the cash production cost per tonne of ore processed was $79.77, up 5% compared to $76.23 in the same prior year period. The all-in sustaining cash production cost per tonne of ore processed was $127.40, up 2%, compared to $124.31 in the same prior year period, but below the Company’s annual cost guidance.
For the nine months ended December 31, 2020, the cash cost per ounce of silver and all-in sustaining cost per ounce of silver, net of by-product credits, at the Ying Mining District, were negative $0.71 and $5.31 respectively, compared to negative $1.40 and $4.55 in the same prior year period. The increase was mainly due to i) the increase in per tonne production costs as discussed above; ii) a decrease of $1.8 million in by-product credits; and iii) a decrease of 4% in silver sold.
For the nine months ended December 31, 2020, approximately 117,773 metres or $2.5 million worth of underground diamond drilling (same prior year period – 73,231 metres or $2.1 million) and 17,786 metres or $5.6 million worth of preparation tunnelling (same prior year period – 17,278 metres or $5.1 million) were completed and expensed as mining preparation costs at the Ying Mining District. In addition, approximately 63,400 metres or $2.9 million worth of surface diamond drilling (same prior year period – nil) and 63,936 metres or $23.4 million worth of horizontal tunnels, raises, and declines (same prior year period – 62,661 metres or $24.3 million) were completed and capitalized.
2. GC Mine, Guangdong Province, China
(i) Q3 Fiscal 2021 vs. Q3 Fiscal 2020
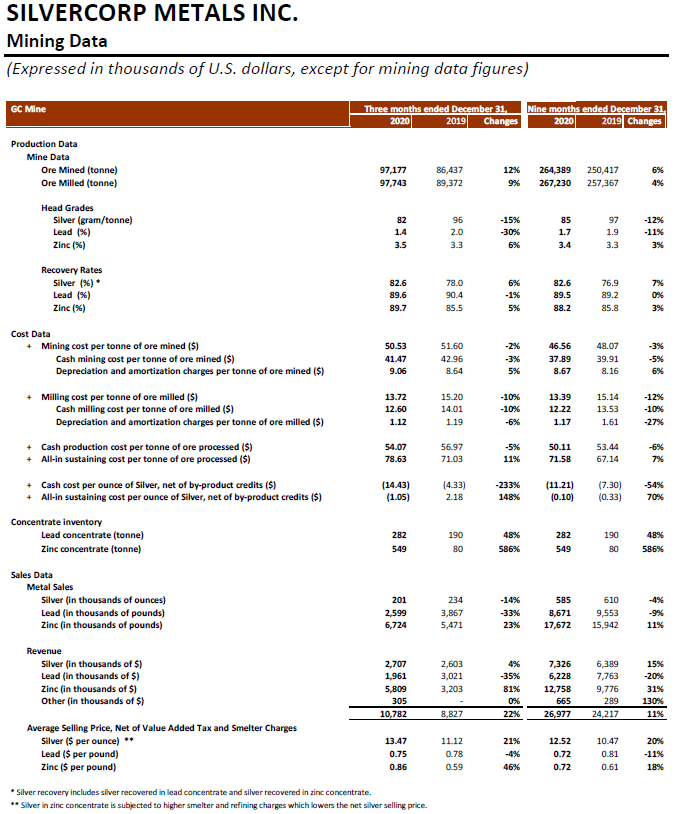
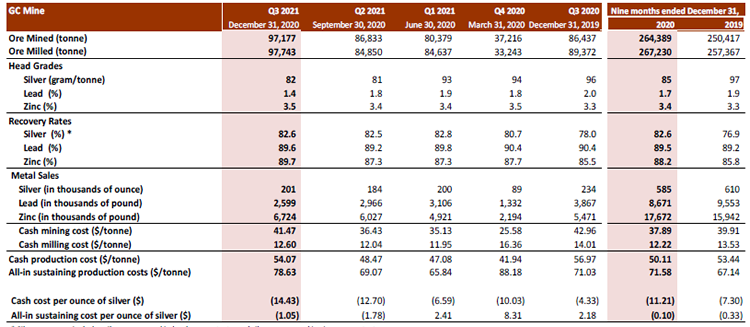
In Q3 Fiscal 2021, the total ore mined at the GC Mine was 97,177 tonnes, up 12% or 10,740 tonnes, compared to 86,437 tonnes in Q3 Fiscal 2020. Ore milled was 97,743 tonnes, up 9% or 8,371 tonnes, compared to 89,372 tonnes in Q3 Fiscal 2020.
Average head grades of ore processed at the GC Mine were 82 g/t for silver, 1.4% for lead, and 3.5% for zinc, compared to 96 g/t for silver, 2.0% for lead, and 3.3% for zinc in Q3 Fiscal 2020. Recovery rates of ore processed were 82.6% for silver, 89.6% for lead, and 89.7% for zinc, compared to 78.0% for silver, 90.4% for lead, and 85.5% for zinc in Q3 Fiscal 2020.
In Q3 Fiscal 2021, GC Mine sold approximately 201 thousand ounces of silver, 2.6 million pounds of lead, and 6.7 million pounds of zinc, compared to 234 thousand ounces of silver, 3.9 million pounds of lead, and 5.5 million pounds of zinc in Q3 Fiscal 2020.
Total and cash mining costs per tonne at the GC Mine in Q3 Fiscal 2021 were $50.53 and $41.47 per tonne, a decrease of 2% and 3%, respectively, compared to $51.60 and $42.96 per tonne in Q3 Fiscal 2020. The decrease in the cash mining cost was mainly due to a $0.2 million decrease in mining preparation costs. Total and cash milling costs per tonne at the GC Mine in Q3 Fiscal 2021 were $13.72 and $12.60, a decrease of 10% and 10%, respectively, compared to $15.20 and $14.01 in Q3 Fiscal 2020.
Correspondingly, the cash production cost per tonne of ore processed in Q3 Fiscal 2021 at the GC Mine was $54.07, down 5% compared to $56.97 in Q3 Fiscal 2020. The all-in sustaining production cost per tonne of ore processed was $78.63, up 11% compared to $71.03 in Q3 Fiscal 2020. The increase was mainly due to an increase of $1.1 million in sustaining capital expenditures.
In Q3 Fiscal 2021, the cash cost per ounce of silver, net of by-product credits, at the GC Mine was negative $14.43 compared to negative $4.33 in Q3 Fiscal 2020. The decrease was mainly due to the decrease in per tonne production costs as discussed above and an increase of $1.9 million in by-product sales.
In Q3 Fiscal 2021, all-in sustaining cost per ounce of silver, net of by-product credits, at the GC Mine was negative $1.05 compared to $2.18 in Q3 Fiscal 2020. The decrease was mainly due to the decrease in cash cost per ounces of silver offset by an increase of $1.0 million in sustaining capital expenditures.
In Q3 Fiscal 2021, approximately 17,029 metres or $0.6 million worth of underground diamond drilling (Q3 Fiscal 2020 – 6,402 metres or $0.3 million) and 4,001 metres or $1.0 million worth of tunnelling (Q3 Fiscal 2020 – 6,599 metres or $1.5 million) were completed and expensed as mining preparation costs at the GC Mine. In addition, approximately 2,815 metres or $1.1 million worth of horizontal tunnels, raises, ramps and declines (Q3 Fiscal 2020 – 532 metres or $0.3 million) were completed and capitalized.
(ii) Nine months ended December 31, 2020 vs. nine months ended December 31, 2019
For the nine months ended December 31, 2020, a total of 264,389 tonnes of ore were mined and 267,230 tonnes were milled at the GC Mine, up 6% and 4%, respectively, compared to 250,417 tonnes mined and 257,367 tonnes milled in the same prior year period. Average head grades of ore milled were 85 g/t for silver, 1.7% for lead, and 3.4% for zinc compared to 97 g/t for silver, 1.9% for lead, and 3.3% for zinc, in the same prior year period.
During the same time period, the GC Mine sold approximately 585 thousand ounces of silver, 8.7 million pounds of lead, and 17.7 million pounds of zinc, compared to 610 thousand ounces of silver, 9.6 million pounds of lead, and 15.9 million pounds of zinc in the same prior year period.
For the nine months ended December 31, 2020, the cash mining cost at the GC Mine was $37.89 per tonne, a decrease of 5% compared to $39.91 per tonne in the same prior year period. The cash milling cost was $12.22 per tonne, a decrease of 10% compared to $13.53 in the same prior year period. Correspondingly, the cash production cost per tonne of ore processed at the GC Mine was $50.11, a decrease of 6% compared to $53.44 in the same prior year period. The all-in sustaining production cost per tonne of ore processed was $71.58, an increase of 7% compared to $67.14 in the same prior year period.
For the nine months ended December 31, 2020, the cash cost per ounce of silver and all-in sustaining cost per ounce of silver, net of by‐product credits, at the GC Mine were negative $11.21 and negative $0.10 respectively, compared to negative $7.30 and negative $0.33 in the same prior year period.
For the nine months ended December 31, 2020, approximately 36,975 metres or $1.7 million worth of underground diamond drilling (same prior year period – 20,313 metres or $0.9 million) and 9,836 metres or $1.8 million of tunnelling (same prior year period – 18,962 metres or $4.5 million) were completed and expensed as mining preparation costs at the GC Mine. In addition, approximately 10,482 metres or $3.3 million of horizontal tunnels, raise, and declines (same prior year period – 1,476 metres or $1.0 million) were completed and capitalized.
FISCAL 2022 PRODUCTION, CASH COST, AND CAPITAL EXPENDITURE GUIDANCE
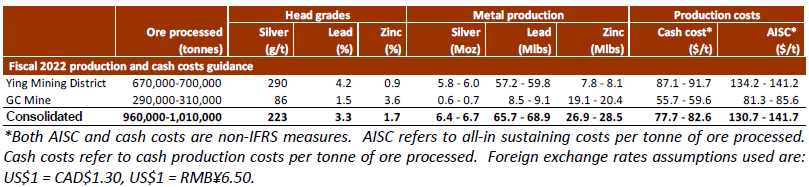
In Fiscal 2022, the Company expects to process approximately 960,000 – 1,010,000 tonnes of ore, yielding 6.4 million to 6.7 million ounces of silver, 65.7 million to 68.9 million pounds of lead, and 26.9 million to 28.5 million pounds of zinc. Fiscal 2022 production guidance represents an anticipated increase of approximately 3% in silver production, and 7% to 10% in zinc production compared to the current Fiscal 2021 guidance. In Fiscal 2022, lead production is expected to be similar to the current Fiscal 2021 guidance.
The Company has been consistently active in exploring its existing mining permit areas through drilling and tunneling, with the objective of replacing the depleted ore. In recent years, the Company has embarked on a capital investment program at both of its mining operations with the objective of adding facilities and infrastructure that will enhance the environmental friendliness, safety, efficiency and future profitability of the mines. This program includes the excavation of additional access ramps and tunnels which are expected to facilitate the efficient movement of ore, equipment and personnel within the mines, as well as provide access to new areas of mineralization that may be suitable for mining in current and future periods. Depending on the extent of each project and the rate of development progress, the spending associated with these projects may be spread across several reporting periods until they are complete.
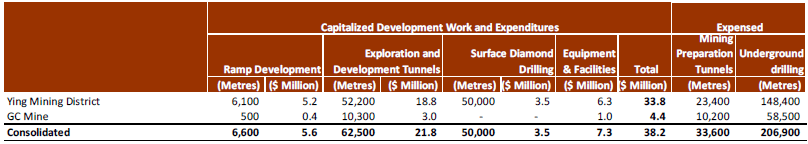
For Fiscal 2022, the Company plans to i) complete 6,600 metres of ramp development tunneling at estimated capitalized expenditures of $5.6 million, representing a 20% decrease in meterage and a 19% decrease in total cost compared to Fiscal 2021 guidance; ii) complete 62,500 metres of exploration and other development tunneling at estimated capitalized expenditures of $21.8 million, representing a 32% decrease in meterage and a 28% decrease in total cost compared to Fiscal 2021 guidance, and iii) spend $7.3 million on equipment and facilities, an increase of 35% compared to Fiscal 2021 guidance. In addition, the Company plans to complete 50,000 metres of surface diamond drilling at estimated capitalized expenditures of $3.5 million. The total capital expenditures are budgeted at $38.2 million, representing a decrease of 10% compared to Fiscal 2021 annual guidance. The Company also plans to complete and expense 33,600 metres of mining preparation tunneling and 206,900 metres of underground diamond drilling. The table below summarizes the work plan and estimated capital expenditures in Fiscal 2022.
(a) Ying Mining District
In Fiscal 2022, the Company plans to mine and process 670,000 to 700,000 tonnes of ore at the Ying Mining District averaging 290 g/t silver, 4.2% lead, and 0.9% zinc with expected metal production of 5.8 million to 6.0 million ounces of silver, 57.2 million to 59.8 million pounds of lead, and 7.8 million to 8.1 million pounds of zinc. Fiscal 2022 production guidance at the Ying Mining District represents increases of approximately 4% to 6% in ore production, 3% to 4% in silver production, 1% to 3% in lead production, and 1% to 11% in zinc production compared to its Fiscal 2021 guidance.
The cash production costs are expected to be $87.1 to $91.7 per tonne of ore, and the all-in sustaining costs are estimated at $134.2 to $141.2 per tonne of ore processed.
In Fiscal 2022, the Ying Mining District plans to i) complete 6,100 metres of ramp development tunneling at estimated capital expenditures of $5.2 million, representing a 9% decrease in meterage and 5% decrease in total cost compared to its Fiscal 2021 guidance; ii) complete 52,200 metres of exploration and other development tunneling at estimated capital expenditures of $18.8 million, representing a 36% decrease in meterage and 30% decrease in total cost compared to its Fiscal 2021 guidance; and iii) spend $6.3 million on equipment and facilities, an increase of 37% compared to its Fiscal 2021 guidance. In addition, the Company plans to complete 50,000 metres of surface diamond drilling at estimated capitalized expenditures of $3.5 million. The total capital expenditures at the Ying Mining District are budgeted at $33.8 million, a decrease of 9% compared to its Fiscal 2021 guidance. The Ying Mining District also plans to complete and expense 23,400 metres of mining preparation tunneling and 148,400 metres of diamond drilling, representing an increase of 11% and 87%, respectively, compared to Fiscal 2021 guidance.
(b) GC Mine
In Fiscal 2022, the Company plans to mine and process 290,000 to 310,000 tonnes of ore at the GC Mine averaging 86 g/t silver, 1.5% lead, and 3.6% zinc with expected metal production of 0.6 million to 0.7 million ounces of silver, 8.5 million to 9.1 million pounds of lead and 19.1 million to 20.4 million pounds of zinc. Fiscal 2022 production guidance at the GC Mine represents similar ore production and silver production, an increase of approximately 9% in zinc production, but a 10% to 13% decrease in lead production due to lower head grade compared to its Fiscal 2021 annual guidance.
The cash production costs are expected to be $55.7 to $59.6 per tonne of ore, and the all-in sustaining costs are estimated at $81.3 to $85.6 per tonne of ore processed.
In Fiscal 2022, the GC Mine plans to i) complete 500 metres of ramp development tunneling at estimated capital expenditures of $0.4 million, representing a 69% decrease in meterage and a decrease of 71% in total cost compared to its Fiscal 2021 guidance; ii) complete 10,300 metres of exploration and development tunneling at estimated capital expenditures of $3.0 million, a 6% decrease in meterage and total cost; and iii) spend $1.0 million on equipment and facilities, an increase of 70% compared to its Fiscal 2021 guidance. The total capital expenditures at the GC Mine are budgeted at $4.4 million, a decrease of 19% compared to its Fiscal 2021 guidance. The GC Mine also plans to complete and expense 10,200 metres of mining preparation tunneling and 58,500 metres of underground diamond drilling.
(c) Other Development Plans
In Fiscal 2022, the Company plans to commence a Phase I 10,000 metre drilling program at the La Yesca Silver Project in Mexico, which drill program is pending receipt of the necessary drilling permits from the respective Mexican government agencies. As a result, the budget for the drill program has not yet been finalized.
The Company plans to initiate an extensive drilling campaign at the Zhonghe Silver Project, located approximately 75 km northeast of the Ying Mining District. The Company will formalize the plan and provide an update on the cost estimates with respect to the Zhonghe Silver Project once the mineral rights transfer contract is executed.
The Company is in the process of applying for permits to build a third tailings facility near the existing tailings facilities at the Ying Mining District. The Company is also considering plans to expand the current milling capacity or build a new mill for future production expansion at the Ying Mining District. There is potential to consolidate mineral properties near the Ying Mining District, or to process ore from the Zhonghe Silver Project during its development stage. The Company will provide further updates when plans and cost estimates are formalized.
Scientific and technical information contained in this news release has been reviewed and approved by Mr. Guoliang Ma, P.Geo., Manager of Exploration and Resources of the Company and a Qualified Person as such the term is defined in National Instrument 43-101 – Standards of Disclosure of Mineral Projects.
This earnings release should be read in conjunction with the Company’s MD&A, Financial Statements and Notes to Financial Statements for the corresponding period, which have been posted on SEDAR under the Company’s profile at www.sedar.com and are also available on the Company’s website at www.silvercorp.ca.
About Silvercorp
Silvercorp is a profitable Canadian mining company producing silver, lead and zinc metals in concentrates from mines in China. The Company’s goal is to continuously create healthy returns to shareholders through efficient management, organic growth and the acquisition of profitable projects. Silvercorp balances profitability, social and environmental relationships, employees’ wellbeing, and sustainable development. For more information, please visit our website at www.silvercorp.ca.
For further information
Silvercorp Metals Inc.
Lon Shaver
Vice President
Phone: (604) 669-9397
Toll Free: 1(888) 224-1881
Email: investor@silvercorp.ca
Website: www.silvercorp.ca
CAUTIONARY DISCLAIMER – FORWARD-LOOKING STATEMENTS
Certain of the statements and information in this news release constitute “forward-looking statements” within the meaning of the United States Private Securities Litigation Reform Act of 1995 and “forward-looking information” within the meaning of applicable Canadian provincial securities laws (collectively, “forward-looking statements”). Any forward-looking statements that express or involve discussions with respect to predictions, expectations, beliefs, plans, projections, objectives, assumptions or future events or performance (often, but not always, using words or phrases such as “expects”, “is expected”, “anticipates”, “believes”, “plans”, “projects”, “estimates”, “assumes”, “intends”, “strategies”, “targets”, “goals”, “forecasts”, “objectives”, “budgets”, “schedules”, “potential” or variations thereof or stating that certain actions, events or results “may”, “could”, “would”, “might” or “will” be taken, occur or be achieved, or the negative of any of these terms and similar expressions) are not statements of historical fact and may be forward-looking statements. Forward-looking statements relate to, among other things: the price of silver and other metals; the accuracy of mineral resource and mineral reserve estimates at the Company’s material properties; the sufficiency of the Company’s capital to finance the Company’s operations; estimates of the Company’s revenues and capital expenditures; estimated production from the Company’s mines in the Ying Mining District and the GC Mine; projected cash operating costs and all-in sustaining costs, and budgets, on a consolidated and mine-by-mine basis; projections included in the Company’s annual cost guidance; timing of receipt of permits and regulatory approvals; availability of funds from production to finance the Company’s operations; and access to and availability of funding for future construction, use of proceeds from any financing and development of the Company’s properties.
Forward-looking statements are subject to a variety of known and unknown risks, uncertainties and other factors that could cause actual events or results to differ from those reflected in the forward-looking statements, including, without limitation, risks relating to: global economic and social impact of COVID-19; fluctuating commodity prices; calculation of resources, reserves and mineralization and precious and base metal recovery; interpretations and assumptions of mineral resource and mineral reserve estimates; exploration and development programs; feasibility and engineering reports; permits and licences; title to properties; property interests; joint venture partners; acquisition of commercially mineable mineral rights; financing; recent market events and conditions; economic factors affecting the Company; timing, estimated amount, capital and operating expenditures and economic returns of future production; integration of future acquisitions into the Company’s existing operations; competition; operations and political conditions; regulatory environment in China and Canada; environmental risks; foreign exchange rate fluctuations; insurance; risks and hazards of mining operations; key personnel; conflicts of interest; dependence on management; internal control over financial reporting; and bringing actions and enforcing judgments under U.S. securities laws, as well as those risks and uncertainties discussed in the Company’s corresponding MD&A and other public filings of the Company. This list is not exhaustive of the factors that may affect any of the Company’s forward-looking statements.
Forward-looking statements are statements about the future and are inherently uncertain, and actual achievements of the Company or other future events or conditions may differ materially from those expressed or implied in the forward-looking statements.
The Company’s forward-looking statements are necessarily based on a number of estimates, assumptions, beliefs, expectations and opinions of management as of the date of this news release that while considered reasonable by management of the Company, are inherently subject to significant business, economic and competitive uncertainties and contingencies. These estimates, assumptions, beliefs, expectations and opinions include, but are not limited to, those related to the Company’s ability to carry on current and future operations, including: the duration and effects of COVID-19 on our operations and workforce; development and exploration activities; the timing, extent, duration and economic viability of such operations; the accuracy and reliability of estimates, projections, forecasts, studies and assessments; the Company’s ability to meet or achieve estimates, projections and forecasts; the availability and cost of inputs; the price and market for outputs; foreign exchange rates; taxation levels; the timely receipt of necessary approvals or permits; the ability to meet current and future obligations; the ability to obtain timely financing on reasonable terms when required; the current and future social, economic and political conditions; and other assumptions and factors generally associated with the mining industry. Other than as required by applicable securities laws, the Company does not assume any obligation to update forward-looking statements if circumstances or management’s assumptions, beliefs, expectations or opinions should change, or changes in any other events affecting such statements. Although the Company has attempted to identify important factors that could cause actual results to differ materially, there may be other factors that cause results not to be as anticipated, estimated, described or intended. For the reasons set forth above, investors should not place undue reliance on forward-looking statements.