VANCOUVER, British Columbia – May 23, 2019 – Silvercorp Metals Inc. (“Silvercorp” or the “Company”) (TSX: SVM) (NYSE American: SVM) reported its financial and operating results for the fourth quarter and twelve months ended March 31, 2019. All amounts are expressed in US Dollars.
FISCAL YEAR 2019 HIGHLIGHTS
- Ore mined up 5% to 906,794 tonnes compared to the prior year;
- Metals sold amounted to approximately 6.4 million ounces of silver, 3,500 ounces of gold, 64.8 million pounds of lead, and 22.7 million pounds of zinc, up 6%, 13%, 5% and 16%, respectively, compared to the prior year;
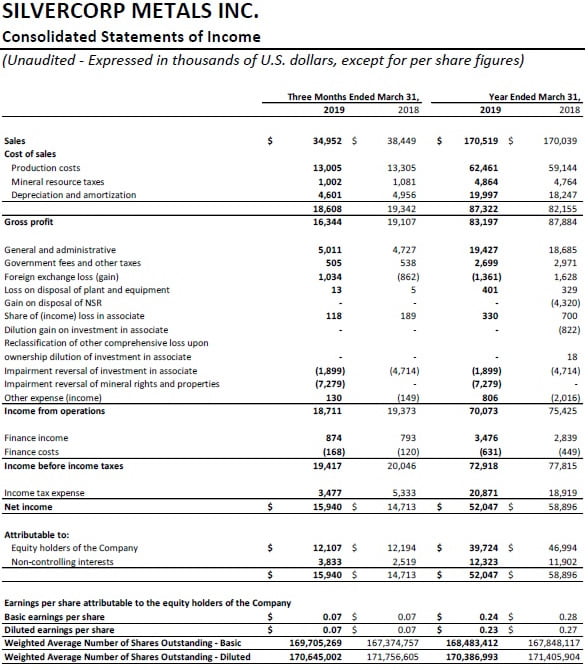
- Sales of $170.5 million, compared to $170.0 million in the prior year;
- Gross profit margin of 49% compared to 52% in the prior year, with the decrease mainly due to lower metal prices;
- Net income attributable to equity shareholders of $39.7 million, or $0.23 per share compared to $47.0 million, or $0.27 per share in the prior year. The adjusted net income attributable to equity shareholders1 of $32.2 million, or $0.19 per share, compared to $41.5 million, or $0.24 per share, in the prior year;
- Cash cost per ounce of silver1, net of by-product credits, of negative $4.29 compared to negative $4.73 in the prior year;
- All-in sustaining cost per ounce of silver1, net of by-product credits, of $3.52, compared to $3.27 in the prior year;
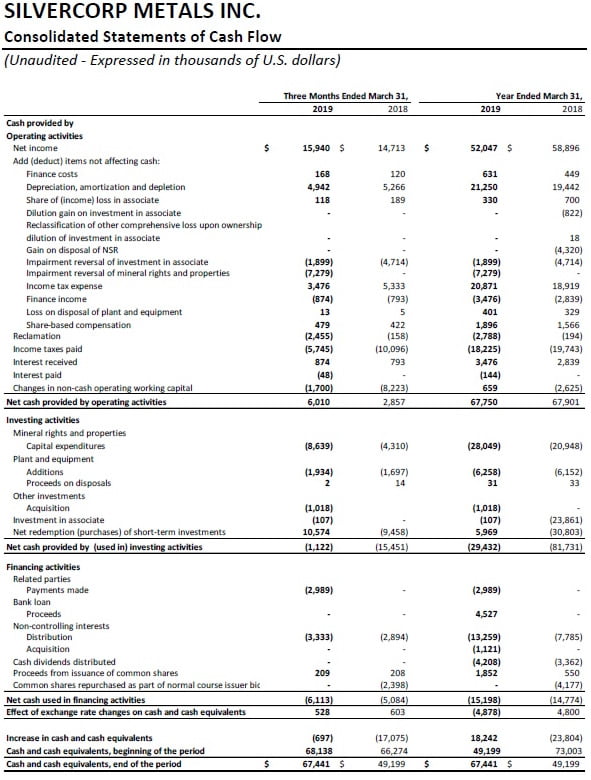
- Cash flow from operations of $67.8 million, compared to $67.9 million in the prior year;
- Paid $18.2 million of income tax, including $5.2 million of withholding tax, compared to $19.7 million of income tax, including $1.0 million of withholding tax in the prior year;
- Paid $4.2 million of dividends to the Company’s shareholders, compared to $3.4 million in the prior year; and
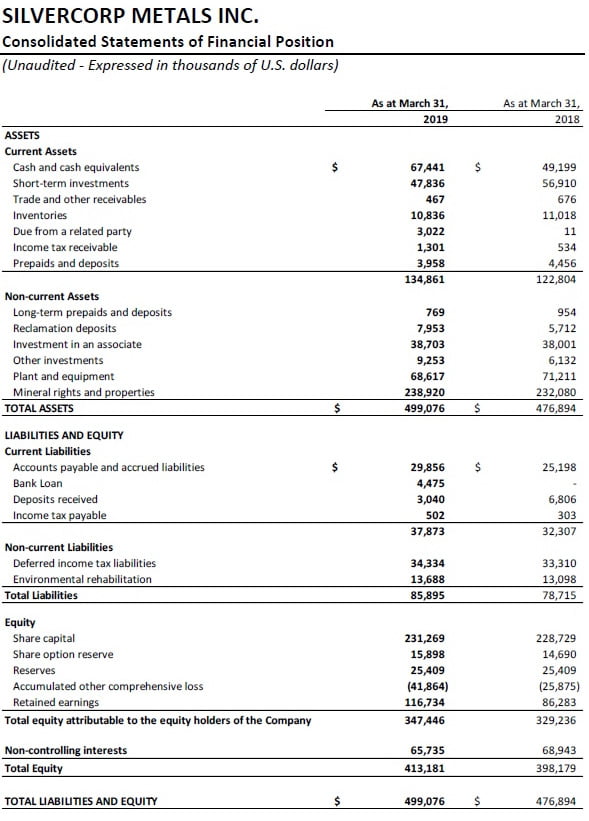
- Ended the fiscal year with $115.3 million in cash and cash equivalents and short-term investments, an increase of $9.2 million or 9%, compared to $106.1 million as at March 31, 2018.
HIGHLIGHTS FOR THE FOURTH QUARTER FISCAL 2019 (“Q4 FISCAL 2019”)
- Ore mined up 13% to 161,400 tonnes compared to the prior year quarter;
- Metals sold amounted to approximately 1.3 million ounces of silver, 700 ounces of gold, 12.7 million pounds of lead, and 7.3 million pounds of zinc, compared to approximately 1.4 million ounces of silver, 700 ounces of gold, 13.3 million pounds of lead, and 2.6 million pounds of zinc sold in the prior year quarter.
- Sales of $35.0 million, down 9% compared to $38.4 million in the prior year quarter;
- Gross profit margin of 47% compared to 50% in the prior year quarter;
- Net income attributable to equity shareholders of $12.1 million, or $0.07 per share compared to $12.2 million or $0.07 per share in the prior year quarter. The adjusted net income attributable to equity shareholders of $4.6 million, or $0.03 per share, compared to $7.5 million, or $0.04 per share, in the prior year quarter;
- Cash cost per ounce of silver, net of by-product credits, of negative $3.97 compared to negative $3.89 in the prior year quarter;
- All-in sustaining cost per ounce of silver, net of by-product credits, of $4.49, compared to $3.04 in the prior year quarter; and
- Cash flow from operations of $6.0 million, compared to $2.9 million in the prior year quarter.
FINANCIALS
- Fiscal 2019 vs. Fiscal 2018
Net income attributable to equity shareholders of the Company in Fiscal 2019 was $39.7 million or $0.23 per share, compared to $47.0 million or $0.27 per share in Fiscal 2018. The adjusted net income attributable to equity shareholders was $32.2 million or $0.19 per share after the adjustment of impairment reversal, compared to the adjusted net income of $41.5 million or $0.24 per share in Fiscal 2018.
Compared to the prior year, the Company’s consolidated financial results in Fiscal 2019 were mainly impacted by i) an increase of 6%, 5% and 16% in silver, lead and zinc sold, respectively; ii) a decrease of 7%, 2% and 17% in the realized selling prices for silver, lead and zinc, respectively; and iii) a 2% increase in total production cost.
Sales in Fiscal 2019 were $170.5 million, up $0.5 million compared to $170.0 million in Fiscal 2018. Silver and gold sales represented $80.7 million and $3.6 million, respectively, while base metals represented $86.2 million of the total sales, compared to silver, gold and base metals sales of $82.4 million, $3.2 million, and $84.5 million, respectively, in Fiscal 2018.
Cost of sales in Fiscal 2019 was $87.3 million compared to $82.2 million in Fiscal 2018. The cost of sales included $62.5 million of cash production costs (Fiscal 2018 – $59.1 million), $4.9 million of mineral resources tax (Fiscal 2018 – $4.8 million), and $20.0 million of depreciation, amortization and depletion charges (Fiscal 2018 – $18.2 million). The increase in the cash production costs expensed and amortization charges were mainly due to a 2% increase in production costs and more metals sold. The increase in mineral resources tax was associated with the increase in revenue. The cash production costs expensed in cost of sales represents approximately 893,000 tonnes of ore processed and expensed at a cost of $69.92 per tonne (Fiscal 2018 – approximately 861,000 tonnes at $68.72 per tonne).
Gross profit margin in Fiscal 2019 was 49%, compared to 52% in Fiscal 2018. The decrease was mainly due to the decrease in the realized metal selling prices. Ying Mining District’s gross profit margin was 52% compared to 55% in Fiscal 2018. GC Mine’s gross profit margin was 35% compared to 36% in Fiscal 2018.
General and administrative expenses were $19.4 million in Fiscal 2019, and increase of 4% compared to $18.7 million in Fiscal 2018. The increase was mainly due to a $0.3 million increase in non-cash stock based compensation expenses and a $1.0 million increase in labour costs, arising primarily from the increase of employees’ pay rate as well as an increase in social insurance premiums in China, offset by a $0.7 million decrease in discretionary office and administrative expenses.
Income tax expenses in Fiscal 2019 were $20.9 million, compared to $18.9 million in Fiscal 2018. The income tax expense recorded in Fiscal 2019 included a current income tax expense of $17.8 million (Fiscal 2018 – $16.1 million) and a deferred income tax expense of $3.1 million (Fiscal 2017 – $2.8 million). The current income tax included $5.2 million of withholding tax (Fiscal 2018 – $1.0 million), which was paid at a rate of 10% of dividends and interest distributed out of China.
Cash flows provided by operating activities in Fiscal 2019 were $67.8 million, slightly lower than the $67.9 million in the prior year. The decrease was mainly due to less operating income arising from lower metal prices and the increase in the withholding tax payment.
The Company ended the fiscal year with $115.3 million cash and short-term investments, an increase of $9.2 million or 9%, compared to $106.1 million as at March 31, 2018.
Working capital as at March 31, 2019 was $96.9 million, an increase of $6.4 million or 7%, compared to $90.5 million as at March 31, 2018.
- Q4 Fiscal 2019 vs. Q4 Fiscal 2018
Net income attributable to equity shareholders of the Company in Q4 Fiscal 2019 was $12.1 million, or $0.07 per share, compared to $12.2 million, or $0.07 per share in Q4 Fiscal 2018. The adjusted net income attributable to equity shareholders was $4.6 million, or $0.03 per share in Q4 Fiscal 2019 after adjustments of impairment reversal of $9.2 million (Q4 Fiscal 2018 – $4.7 million) compared to $7.5 million or $0.04 per share in Q4 Fiscal 2018.
Compared to the prior year quarter, the Company’s consolidated financial results in Q4 Fiscal 2019 were mainly impacted by the following: i) a decrease of 11%, 3%, 18%, and 41% in the net realized selling prices for silver, gold, lead, and zinc, respectively; ii) a 5% decrease in silver and lead sold; iii) a 184% increase in zinc sold; and iii) a 7% decrease in per tonne production costs.
Sales were $35.0 million, down 9%, in Q4 Fiscal 2019, compared to $38.4 million in Q4 Fiscal 2018. The decrease was mainly due to the decrease in net realized selling prices and less silver and lead sold. Silver and gold sales represented $16.7 million and $0.8 million, respectively, while base metals represented $17.5 million of total sales, compared to silver, gold and base metals of $19.8 million, $0.8 million, and $17.9 million, respectively, in the prior year quarter.
Cost of sales was $18.6 million in Q4 Fiscal 2019, compared to $19.3 million in Q4 Fiscal 2018. The cost of sales included $13.0 million of cash production cost (Q4 Fiscal 2018 – $13.3 million), $1.0 million of mineral resource taxes (Q4 Fiscal 2018 – $1.1 million), and $4.6 million of depreciation, amortization and depletion charges (Q4 Fiscal 2018 – $5.0 million).
Gross profit margin decreased to 47% in Q4 Fiscal 2019, compared to 50% in Q4 Fiscal 2018.
Cash flows provided by operating activities in Q4 Fiscal 2019 were $6.0 million, an increase of $3.1 million, compared to $2.9 million in Q4 Fiscal 2018.
OPERATIONS AND DEVELOPMENT
- Fiscal 2019 vs. Fiscal 2018
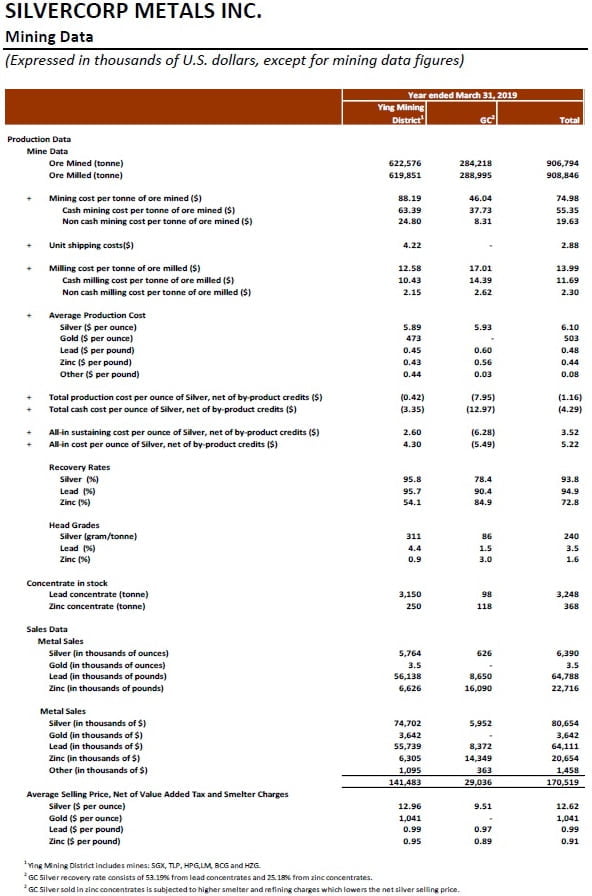
In Fiscal 2019, on a consolidated basis, the Company mined 906,794 tonnes of ore, an increase of 5% or 46,870 tonnes, compared to 859,924 tonnes in Fiscal 2018. Ore mined at the Ying Mining District increased by 1% or 8,435 tonnes, and ore mined at the GC Mine increased by 16% or 38,435 tonnes. Ore milled in Fiscal 2019 was 908,846 tonnes, an increase of 5% compared to 863,070 tonnes in Fiscal 2018.
In Fiscal 2019, the Company sold approximately 6.4 million ounces of silver, 3,500 ounces of gold, 64.8 million pounds of lead, and 22.7 million pounds of zinc, up 6%, 13%, 5%, and 16%, respectively, compared to 6.0 million ounces of silver, 3,100 ounces of gold, 61.9 million pounds of lead, and 19.6 million pounds of zinc in Fiscal 2018.
The consolidated total mining cost and cash mining cost were $74.98 and $55.35 per tonne, up 2% and 1%, respectively, compared to $73.48 and $54.60 per tonne, respectively, in Fiscal 2018. The increase in cash mining cost was mainly due to inflation resulting in an increase of i) $1.1 million in mining contractor’s costs; ii) $0.6 million in raw material costs; and iii) $0.6 million in utility costs.
The consolidated total milling cost and cash milling cost were $13.99 and $11.69 per tonne, up 1% and 4%, respectively, compared to $13.82 and $11.25 per tonne, respectively, in Fiscal 2018. The increase in the cash milling cost was mainly due to a $0.4 million increase in raw material costs.
The consolidated cash production cost per tonne of ore processed in Fiscal 2019 was $69.92, a 2% increase compared to $68.72 in Fiscal 2018, but below the Company’s annual guidance.
The consolidated total production cost and cash production cost per ounce of silver, net of by-product credits, were negative $1.16 and negative $4.29, respectively, compared to negative $1.70 and negative $4.73, respectively, in the prior year. The increase was mainly due to a $3.3 million increase in cash production cost expensed offset by a $2.2 million increase in by-product credits.
The consolidated all-in sustaining cost per ounce of silver, net of by-product credits, was $3.52 compared to $3.27 in Fiscal 2018. The increase was mainly due to i) a $3.4 million increase in cash production cost expensed; ii) a $0.7 million increase in general and administrative expenses; and iii) a $1.0 million increase in sustaining capital expenditures, offset by a $2.2 million increase in by-product credits.
- Q4 Fiscal 2019 vs. Q4 Fiscal 2018
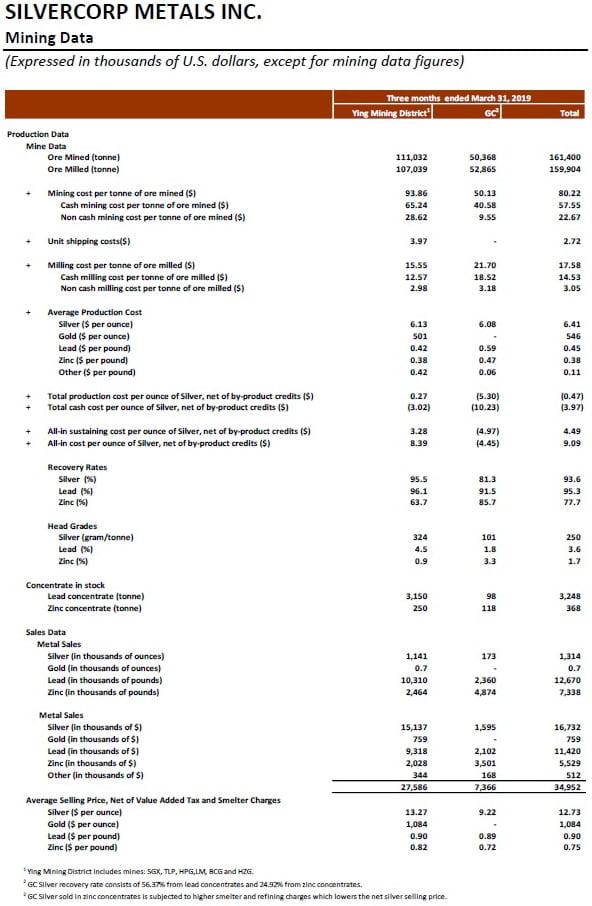
In Q4 Fiscal 2019, the Company mined 161,400 tonnes of ore, and increase of 13%, compared to 143,262 tonnes in Q4 Fiscal 2018. Correspondingly, ore milled in Q4 Fiscal 2019 was 159,904 tonnes, an increase of 15% compared to 138,537 tonnes in Q4 Fiscal 2018.
In Q4 Fiscal 2019, the Company sold approximately 1.3 million ounces of silver, 700 ounces of gold, 12.7 million pounds of lead, and 7.3 million pounds of zinc compared to 1.4 million ounces of silver, 700 ounces of gold, 13.3 million pounds of lead, and 2.6 million pounds of zinc in Q4 Fiscal 2018.
The consolidated total mining cost and cash mining cost were $80.22 and $57.55 per tonne, down 6% and 7%, respectively, compared to $85.55 and $61.78 per tonne in Q4 Fiscal 2018. The consolidated total milling cost and cash milling cost in Q4 Fiscal 2019 were $17.58 and $14.53 per tonne, down 8% and 3%, respectively, compared to $19.14 and $14.96 per tonne in Q4 Fiscal 2018.
The consolidated total production cost and cash production cost per ounce of silver, net of by-product credits, were negative $0.47 and negative $3.97, respectively, compared to negative $0.30 and negative $3.89 in Q4 Fiscal 2018. The improvement was mainly due to the decrease in per tonne mining and milling cost as discussed above.
The consolidated all-in sustaining cost per ounce of silver, net of by-product credits, was $4.49 compared to $3.04 in Q4 Fiscal 2018. The increase was mainly due to an increase of $1.4 million in sustaining capital expenditures.
- Ying Mining District, Henan Province, China
Fiscal 2019 vs. Fiscal 2018
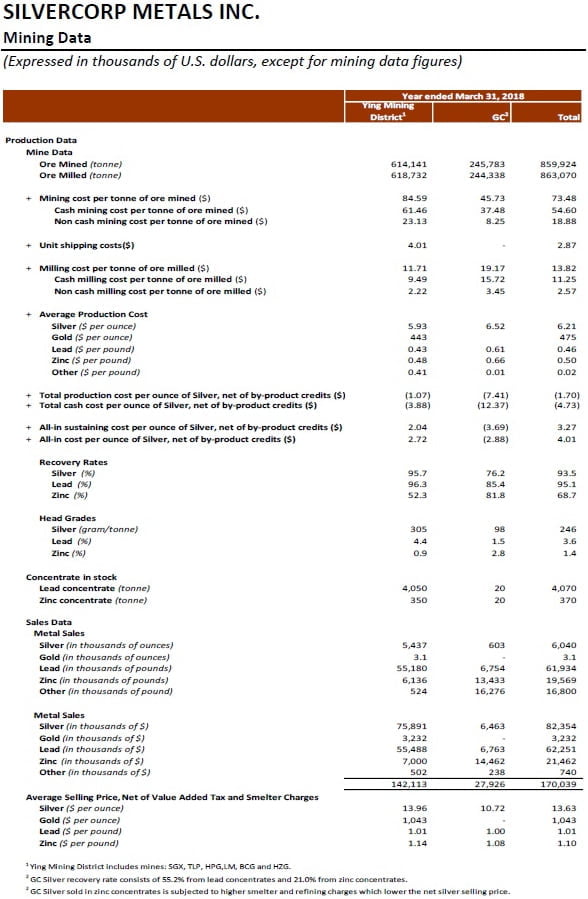
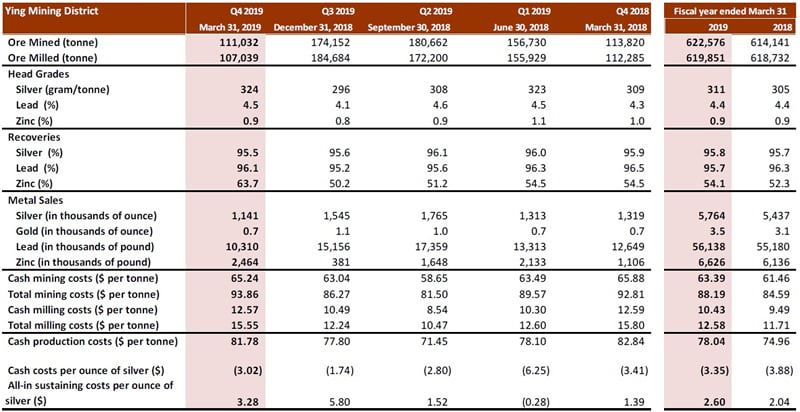
In Fiscal 2019, the total ore mined at the Ying Mining District was 622,576 tonnes, an increase of 1% or 8,435 tonnes, compared to 614,141 tonnes mined in Fiscal 2018. Ore milled was 619,851 tonnes, an increase of 1,119 tonnes compared to 618,732 tonnes in Fiscal 2018.
Head grades of ore milled at the Ying Mining District in Fiscal 2019 were 311 grams per tonne (“g/t”) for silver, 4.4% for lead, and 0.9% for zinc, compared to 305 g/t for silver, 4.4% for lead, and 0.9% for zinc in Fiscal 2018. The Company continues to achieve positive dilution control using its “Enterprise Blog” to assist and manage daily operations.
In Fiscal 2019, the Ying Mining District sold approximately 5.8 million ounces of silver, 3,500 ounces of gold, 56.1 million pounds of lead, and 6.6 million pounds of zinc, up 6%, 13%, 2% and 8%, respectively, compared to 5.4 million ounces of silver, 3,100 ounces of gold, 55.2 million pounds of lead, and 6.1 million pounds of zinc in Fiscal 2018. As at March 31, 2019, the Ying Mining District has inventories of 3,150 tonnes of silver-lead concentrate and 250 tonnes of zinc concentrate, compared to 4,050 tonnes of silver-lead concentrate and 350 tonnes of zinc concentrate as at March 31, 2018.
Total mining cost and cash mining cost per tonne at the Ying Mining District in Fiscal 2019 were $88.19 and $63.39 per tonne, respectively, compared to $84.59 and $61.46 per tonne, respectively, in Fiscal 2018. The increase was mainly due to inflation resulting in an increase of i) $0.6 million in mining contractor’s costs, ii) $0.4 million in raw material costs, and iii) $0.7 million in utility costs. Total milling cost and cash milling cost per tonne at the Ying Mining District in Fiscal 2019 were $12.58 and $10.43, respectively, compared to $11.71 and $9.49, respectively, in Fiscal 2018.
Correspondingly, the total production cost and cash production cost per tonne of ore processed in Fiscal 2019 at the Ying Mining District were $104.99 and $78.04, respectively, compared to $100.31 and $74.96 in Fiscal 2018.
Cash cost per ounce of silver, net of by-product credits, at the Ying Mining District in Fiscal 2019, was negative $3.35 compared to negative $3.88 in the prior year. The increase in the cash cost per ounce of silver, net of by-product credits, was mainly due to a $2.4 million increase in cash production cost expensed offset by a $0.6 million increase in by-product credits.
All-in sustaining cost per ounce of silver, net of by-product credits, at the Ying Mining District in Fiscal 2019, was $2.60 compared to $2.04 in the prior year. The increase was mainly due to increases of $2.4 million in cash production costs expensed and $2.2 million in sustaining capital expenditures.
In Fiscal 2019, approximately 75,955 metres or $1.8 million worth of underground diamond drilling (Fiscal 2018 – 104,798 metres or $2.3 million) and 18,656 metres or $5.4 million worth of preparation tunnelling (Fiscal 2018 – 19,723 metres or $5.8 million) were completed and expensed as mining preparation costs at the Ying Mining District. In addition, approximately 65,653 metres or $23.2 million worth of horizontal tunnels, raises, ramps and declines (Fiscal 2018 – 61,827 metres or $20.1 million) were completed and capitalized.
Q4 Fiscal 2019 vs. Q4 Fiscal 2018
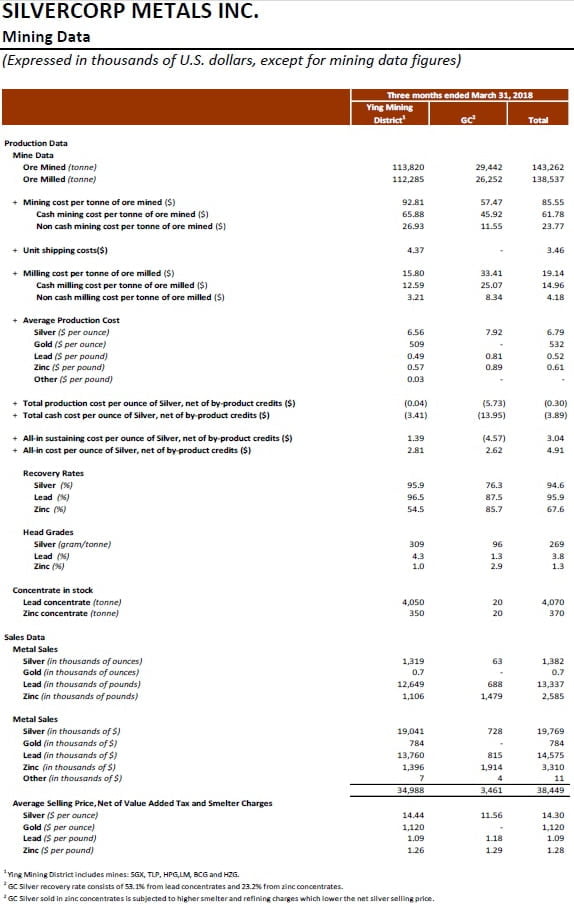
In Q4 Fiscal 2019, a total of 111,032 tonnes of ore were mined at the Ying Mining District, a decrease of 2% or 2,788 tonnes, compared to 113,820 tonnes in Q4 Fiscal 2018. Ore milled was 107,039 tonnes, a decrease of 3% or 5,246 tonnes, compared to 112,285 tonnes in Q4 Fiscal 2018.
Average head grades of ore processed were 324 g/t for silver, 4.5% for lead, and 0.9% for zinc compared to 309 g/t for silver, 4.3% for lead, and 1.0% for zinc in Q4 Fiscal 2018.
Metals sold were approximately 1.1 million ounces of silver, 700 ounces of gold, 10.3 million pounds of lead, and 2.5 million pounds of zinc, compared to 1.3 million ounces of silver, 700 ounces of gold, 12.6 million pounds of lead, and 1.1 million pounds of zinc in Q4 Fiscal 2018.
In Q4 Fiscal 2019, the cash mining cost at the Ying Mining District was $65.24 per tonne, down 1% compared to $65.88 in Q4 Fiscal 2018. The cash milling cost was $12.57 per tonne compared to $12.59 in Q4 Fiscal 2018.
In Q4 Fiscal 2019, cash cost per ounce of silver and all in sustaining cost per ounce of silver, net of by-product credits, at the Ying Mining District were negative $3.02 and $3.28, respectively, compared to negative $3.41 and $1.39 in Q4 Fiscal 2018.
In Q4 Fiscal 2019, approximately 6,083 metres or $0.3 million worth of underground diamond drilling (Q4 Fiscal 2018 – 18,791 metres or $0.6 million) and 3,061 metres or $1.0 million worth of preparation tunnelling (Q4 Fiscal 2018 – 2,809 metres or $0.9 million) were completed and expensed as mining preparation costs at the Ying Mining District. In addition, approximately 10,730 metres or $4.0 million worth of horizontal tunnels, raises, and declines (Q4 Fiscal 2018 – 9,653 metres or $3.9 million) were completed and capitalized.
- GC Mine, Guangdong Province, China
Fiscal 2019 vs. Fiscal 2018
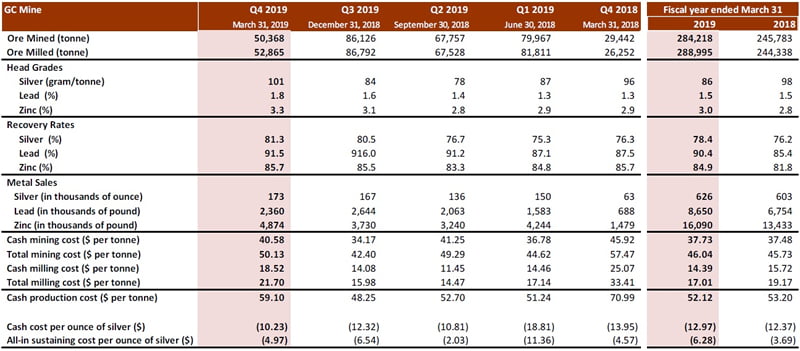
In Fiscal 2019, the total ore mined at the GC Mine was 284,218 tonnes, an increase of 16% or 38,435 tonnes, compared to 245,783 tonnes in Fiscal 2018, while ore milled was 288,995 tonnes, an increase of 18% or 44,657 tonnes, compared to 244,338 tonnes in Fiscal 2018.
Average head grades of ore processed at the GC Mine were 86 g/t for silver, 1.5% for lead, and 3.0% for zinc compared to 98 g/t for silver, 1.5% for lead, and 2.8% for zinc in the prior year. Recovery rates of ore processed at the GC Mine were78.4% for silver, 90.4% for lead, and 84.9% for zinc, compared to 76.2% for silver, 85.4% for lead, and 81.8% for zinc in Fiscal 2018.
In Fiscal 2019, the GC Mine sold 626,000 ounces of silver, 8.7 million pounds of lead, and 16.1 million pounds of zinc, compared to 603,000 ounces of silver, 6.8 million pounds of lead, and 13.4 million pounds of zinc in Fiscal 2018.
Total mining cost and cash mining cost at the GC Mine in Fiscal 2019 were $46.04 and $37.73 per tonne, respectively, a slight increase of 1% compared to $45.73 and $37.48 per tonne, respectively, in Fiscal 2018. Total milling cost and cash milling cost per tonne at the GC Mine were $17.01 and $14.39, respectively, down 11% and 8%, compared to $19.17 and $15.72, respectively, in Fiscal 2018.
Correspondingly, total production cost and cash production cost per tonne of ore processed in Fiscal 2019 at the GC Mine were $63.05 and $52.12, respectively, a decrease of 3% and 2%, compared to $64.90 and $53.20, respectively, in Fiscal 2018.
Cash cost per ounce of silver, net of by-product credits, at the GC Mine, was negative $12.97 compared to negative $12.37 in the prior year. The decrease was mainly due to a 4% increase in by-product credits resulting from increases of 28% in lead and 20% in zinc sold offset by a decrease of 3% and 17% in net realized lead and zinc selling prices at the GC Mine.
All-in sustaining cost per ounce of silver, net of by-product credits, in Fiscal 2019 at the GC Mine was negative $6.28 compared to negative $3.69 in the prior year. The improvement was mainly due to an increase of $1.6 million in by-product credits and a decrease of $0.9 million in sustaining capital expenditures.
In Fiscal 2019, approximately 24,727 metres or $1.3 million worth of underground diamond drilling (Fiscal 2018 – 21,717 metres or $1.1 million) and 19,844 metres or $5.2 million worth of tunnelling (Fiscal 2018 – 15,811 metres or $4.5 million) were completed and expensed as mining preparation costs at the GC Mine. In addition, approximately 1,374 metres or $1.0 million of horizontal tunnels, raises and declines (Fiscal 2018 – 320 metres or $0.3 million) were completed and capitalized.
Q4 Fiscal 2019 vs. Q4 Fiscal 2018
In Q4 Fiscal 2019, a total of 50,368 tonnes of ore were mined and 52,865 tonnes were milled at the GC Mine, up 71% and 101%, respectively, compared to 29,442 tonnes mined and 26,252 tonnes milled in Q4 Fiscal 2018.
Average head grades of ore milled were 101 g/t for silver, 1.8% for lead, and 3.3% for zinc compared to 96 g/t for silver, 1.3% for lead, and 2.9% for zinc in the same prior year quarter.
Metals sold were approximately 173,000 ounces of silver, 2.4 million pounds of lead, and 4.9 million pounds of zinc, compared to 63,000 ounces of silver, 0.7 million pounds of lead, and 1.5 million pounds of zinc in the same prior year quarter.
The cash mining cost at the GC Mine was $40.58 per tonne, a decrease of 12% compared to $45.92 per tonne in the same prior year quarter. The cash milling cost was $18.52 per tonne, a decrease of 26% compared to $25.07 in the same prior year quarter. Correspondingly, the cash production cost per tonne decreased by 17% to $59.10 from $70.99 in the same prior year quarter. The improvement in production cost was mainly due to higher production output resulting in lower fixed cost allocation.
Cash cost per ounce of silver and all-in sustaining cost per ounce of silver, net of by‐product credits, at the GC Mine, for Q4 Fiscal 2019, were negative $10.23 and negative $4.97, respectively, compared to negative $13.95 and negative $4.57 in the same prior year quarter.
In Q4 Fiscal 2019, approximately 2,864 metres or $0.3 million worth of underground diamond drilling (Q4 Fiscal 2018 – 3,464 metres or $0.2 million) and 3,366 metres or $0.9 million of tunnelling (Q4 Fiscal 2018 – 1,526 metres or $0.7 million) were completed and expensed as mining preparation costs at the GC Mine. In addition, approximately 262 metres or $0.2 million of horizontal tunnels, raise, and declines (Q4 Fiscal 2018 – 40 metres or $0.1 million) were completed and capitalized.
Mr. Guoliang Ma, P.Geo., Manager of Exploration and Resources of the Company, is the Qualified Person as defined by National Instrument 43-101 – Standards of Disclosure for Mineral Projects (“NI 43-101”) and has reviewed and given consent to the technical information contained in this news release.
This earnings release should be read in conjunction with the Company’s Management Discussion & Analysis, Financial Statements and Notes to Financial Statements for the corresponding period, which have been posted on SEDAR under the Company’s profile at www.sedar.com and are also available on the Company’s website at www.silvercorp.ca.
About Silvercorp
Silvercorp is a Canadian low-cost silver-producer of silver, lead and zinc from mines in China. We deliver shareholder value through efficient management, organic growth, and the acquisition of projects we can build and operate profitably. Silvercorp’s goal is to achieve lasting and sustainable development for all our stakeholders. For more information, please visit our website at www.silvercorp.ca.
For further information
Silvercorp Metals Inc.
Lon Shaver
Vice President
Phone: (604) 669-9397
Toll Free 1(888) 224-1881
Email: investor@silvercorp.ca
Website: www.silvercorp.ca
CAUTIONARY DISCLAIMER – FORWARD-LOOKING STATEMENTS
Certain of the statements and information in this news release constitute “forward-looking statements” within the meaning of the United States Private Securities Litigation Reform Act of 1995 and “forward-looking information” within the meaning of applicable Canadian provincial securities laws (collectively, “forward-looking statements”). Any statements or information that express or involve discussions with respect to predictions, expectations, beliefs, plans, projections, objectives, assumptions or future events or performance (often, but not always, using words or phrases such as “expects”, “is expected”, “anticipates”, “believes”, “plans”, “projects”, “estimates”, “assumes”, “intends”, “strategies”, “targets”, “goals”, “forecasts”, “objectives”, “budgets”, “schedules”, “potential” or variations thereof or stating that certain actions, events or results “may”, “could”, “would”, “might” or “will” be taken, occur or be achieved, or the negative of any of these terms and similar expressions) are not statements of historical fact and may be forward-looking statements. Forward-looking statements relate to, among other things: the price of silver and other metals; the accuracy of mineral resource and mineral reserve estimates at the Company’s material properties; the sufficiency of the Company’s capital to finance the Company’s operations; estimates of the Company’s revenues and capital expenditures; estimated production from the Company’s mines in the Ying Mining District and the GC Mine; timing of receipt of permits and regulatory approvals; availability of funds from production to finance the Company’s operations; and access to and availability of funding for future construction, use of proceeds from any financing and development of the Company’s properties.
Forward-looking statements are subject to a variety of known and unknown risks, uncertainties and other factors that could cause actual events or results to differ from those reflected in the forward-looking statements, including, without limitation, risks relating to: fluctuating commodity prices; calculation of resources, reserves and mineralization and precious and base metal recovery; interpretations and assumptions of mineral resource and mineral reserve estimates; exploration and development programs; feasibility and engineering reports; permits and licences; title to properties; property interests; joint venture partners; acquisition of commercially mineable mineral rights; financing; recent market events and conditions; economic factors affecting the Company; timing, estimated amount, capital and operating expenditures and economic returns of future production; integration of future acquisitions into the Company’s existing operations; competition; operations and political conditions; regulatory environment in China and Canada; environmental risks; foreign exchange rate fluctuations; insurance; risks and hazards of mining operations; key personnel; conflicts of interest; dependence on management; internal control over financial reporting; and bringing actions and enforcing judgments under U.S. securities laws.
This list is not exhaustive of the factors that may affect any of the Company’s forward-looking statements. Forward-looking statements are statements about the future and are inherently uncertain, and actual achievements of the Company or other future events or conditions may differ materially from those reflected in the forward-looking statements due to a variety of risks, uncertainties and other factors, including, without limitation, those referred to in the Company’s Annual Information Form under the heading “Risk Factors”. Although the Company has attempted to identify important factors that could cause actual results to differ materially, there may be other factors that cause results not to be as anticipated, estimated, described or intended. Accordingly, readers should not place undue reliance on forward-looking statements.
The Company’s forward-looking statements are based on the assumptions, beliefs, expectations and opinions of management as of the date of this news release, and other than as required by applicable securities laws, the Company does not assume any obligation to update forward-looking statements if circumstances or management’s assumptions, beliefs, expectations or opinions should change, or changes in any other events affecting such statements. For the reasons set forth above, investors should not place undue reliance on forward-looking statements.