VANCOUVER, British Columbia – February 2, 2017 – Silvercorp Metals Inc. (“Silvercorp” or the “Company”) (TSX: SVM) reported its financial and operating results for the third quarter and nine months ended December 31, 2016. All amounts are expressed in US Dollars.
HIGHLIGHTS FOR THE THREE QUARTERS ENDED DECEMBER 31, 2016
- Net income attributable to equity shareholders of $30.2 million, or $0.18 per share, up 284% compared with net income attributable to equity shareholders of $7.9 million or $0.05 per share in the prior year period;
- Silver, lead and zinc metals sold up 28%, 32%, and 22%, respectively, from the prior year period, to approximately 5.2 million ounces silver, 56.1 million pounds lead, and 16.8 million pounds zinc;
- Silver production for the three quarters has already surpassed the Fiscal 2017 annual production guidance by approximately 2%;
- Sales of $129.4 million, up 46% compared to $88.5 million in the prior year period;
- A 15%, 16%, and 15% increase in the head grades of silver, lead, and zinc compared to the prior year period;
- A 13%,13%, and 23% increase in the net realized selling prices of silver, lead, and zinc compared to the prior year period;
- Gross margin improved to 54% from 34% in the prior year period;
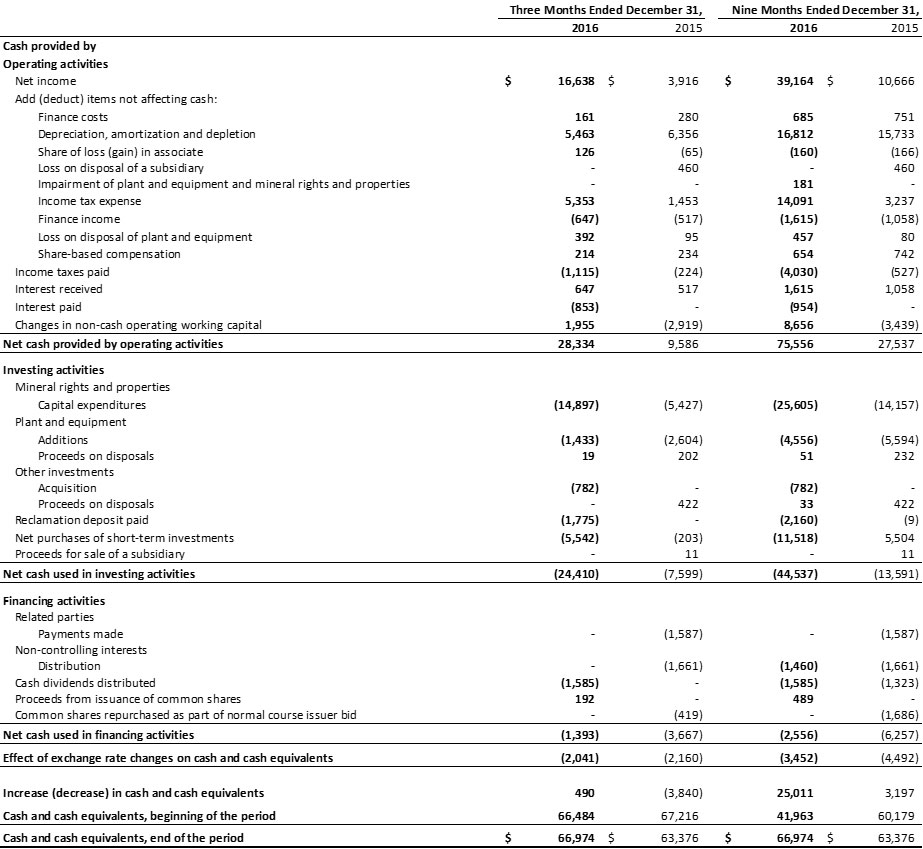
- Cash flows from operations of $75.6 million, or $0.44 per share, an increase of $48.1 million compared to $27.5 million, or $0.16 per share in the prior year period;
- Cash production cost per tonne of decreased by 14% to $59.26 from $69.12 in the prior year period;
- Cash cost per ounce of silver1, net of by-product credits, of negative $2.88, compared to $1.26 in the prior year period;
- All-in sustaining cost per ounce of silver1, net of by-product credits, of $3.96, compared to $10.27 in the prior year period; and
- Ended the period with $97.4 million in cash and short term investments, an increase of $35.4 million or 60% compared to $62.0 million as at March 31, 2016.
HIGHLIGHTS FOR THE THIRD QUARTER FISCAL 2017 (“Q3 FISCAL 2017”)
- Net income attributable to equity shareholders of $13.1 million, or $0.08 per share, up 294% compared with net income attributable to equity shareholders of $3.3 million or $0.02 per share in the prior year quarter;
- Silver, lead and zinc metals sold up 22%, 29%, and 21%, respectively, from the prior year quarter, to approximately 1.7 million ounces silver, 19.5 million pounds lead, and 5.7 million pounds zinc;
- Sales of $47.8 million, up 64% compared to $29.1 million from the prior year quarter;
- A 5%, 9%, and 15% increase in the head grades of silver, lead, and zinc compared to the prior year quarter;
- A 15%, 52%, and 83% increase in the net realized selling prices of silver, lead, and zinc compared to the prior year quarter;
- Gross margin improved to 58% from 33% in the prior year quarter;
- Cash flows from operations of $28.3 million, an increase of $18.7 million compared to $9.6 million in the prior year quarter;
- Cash production cost per tonne of $60.51, down 8% compared with $65.59 in the prior year quarter;
- Cash cost per ounce of silver, net of by-product credits, of negative $5.48, compared to $0.90 in the prior year quarter; and
- All-in sustaining cost per ounce of silver, net of by-product credits, of $1.87, compared to $7.72 in the prior year quarter.
FINANCIALS
Net income attributable to the shareholders of the Company in Q3 Fiscal 2017 was $13.1 million, or $0.08 per share, up 294% compared to $3.3 million, or $0.02 per share in Q3 Fiscal 2016.
In the current quarter, the Company’s financial results were mainly impacted by the following: i) improved head grades yielded higher silver, lead, zinc sales, up 5%, 9% and 15%, respectively; ii) a 8% decrease in total production costs per tonne of ore processed; and iii) the increase of metals prices, as the realized selling price for silver, lead, and zinc increased by 15%, 52% and 83%, respectively, compared to the same prior year quarter.
Sales in Q3 Fiscal 2017 were $47.8 million, up 64% compared to $29.1 million in Q3 Fiscal 2016. Silver and gold sales represented $23.4 million and $0.7 million, respectively, while base metals represented $23.7 million of total sales in this quarter compared to silver, gold and base metals of $16.8 million, $0.4 million, and $11.9 million, respectively, in Q3 Fiscal 2016.
Cost of sales in Q3 Fiscal 2017 was $20.1 million compared to $19.5 million in Q3 Fiscal 2016. The cost of sales included $14.9 million (Q3 Fiscal 2016 – $13.5 million) cash costs and $5.2 million (Q3 Fiscal 2016 – $6.0 million) depreciation, amortization and depletion charges. The increase of cash cost of sales was mainly due to the increase of metals sold offset by an 8% decrease in cash production costs per tonne of ore processed. The total per tonne ore production cost was $82.19 in Q3 Fiscal 2017, a decrease of 5%, from $86.47 in Q3 Fiscal 2016.
Gross profit margin in Q3 Fiscal 2017 was 58% compared to 33% in Q3 Fiscal 2016. The improvement of gross profit margin was mainly due to: i) a 5%, 9%, and 15% increase in the head grades of silver, lead, and zinc; ii) a 5% decrease in per tonne ore production costs; and iii) the increase of metal prices. Ying Mining District’s gross profit margin was 61% compared to a 40% gross profit margin in the same prior year quarter, while GC Mine’s profit margin was 42% compared to a 3% gross profit margin in Q3 Fiscal 2016.
Cash flows provided by operating activities in Q3 Fiscal 2017 were $28.3 million or $0.17 per share compared to $9.6 million or $0.06 per share in Q3 Fiscal 2016. Before changes in non-cash operating working capital, cash flows provided by operating activities were $26.4 million, an increase of $13.9 million or 111%, compared to $12.5 million in Q3 Fiscal 2016 as a result of the improvement of operating earnings.
For the nine months ended December 31, 2016, net income attributable to the shareholders of the Company was $30.2 million, or $0.18 per share, up 284% compared to $7.9 million, or $0.05 per share in the same prior year period; sales were $129.4 million, up 46% from $88.5 million in the same prior year period; and cash flows provided by operating activities were $75.6 million or $0.44 per share compared to $27.5 million or $0.16 per share in the same prior year period. Before changes in non-cash operating working capital, cash flows provided by operating activities for the nine months ended December 31, 2016 were $66.9 million, an increase of $35.9 million or 116%, compared to $31.0 million in the same prior year period.
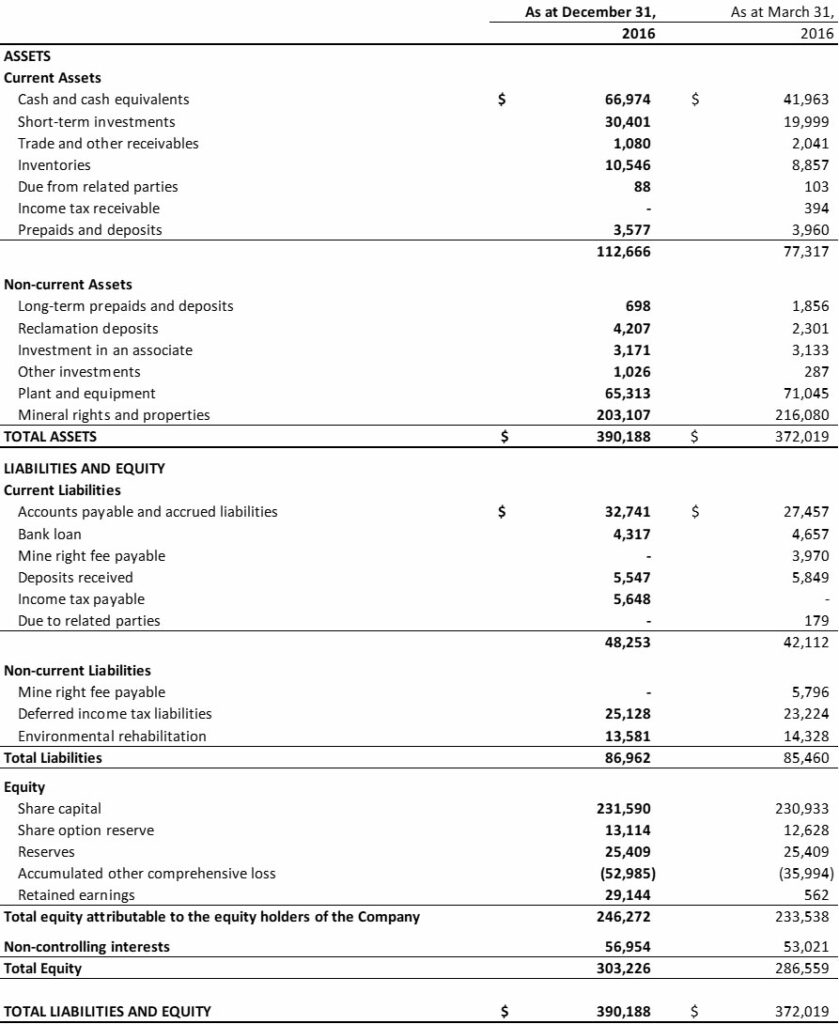
The Company ended the period with $97.4 million in cash and short term investments, an increase of $35.4 million or 60% compared to $62.0 million as at March 31, 2016.
OPERATIONS AND DEVELOPMENT
In Q3 Fiscal 2017, the Company sold approximately 1.7 million ounces of silver, 19.5 million pounds of lead, and 5.7 million pounds of zinc, up 22%, 29% and 21%, respectively, compared to 1.4 million ounces of silver, 15.1 million pounds of lead, and 4.7 million pounds of zinc in Q3 Fiscal 2016. The increase of metals sold, on a consolidated basis, was mainly due to: i) a 5%, 9%, and 15% increase in the head grades of silver, lead and zinc, resulting largely from the ongoing dilution control measures and operation management improvements; and ii) a 18% increase of ore milled. In addition, as at the end of Q3 Fiscal 2017, the Ying Mining District held 4,656 tonnes of silver-lead concentrate inventories, and the estimated metals contained in silver-lead concentrate were approximately 0.5 million ounces of silver and 5.3 million pounds of lead.
For the nine months ended December 31, 2016, on a consolidated basis, the Company sold approximately 5.2 million ounces of silver, 56.1 million pounds of lead, and 16.8 million pounds of zinc, up 28%, 32% and 22% compared to the same prior year period.
1. Ying Mining District, Henan Province, China

In Q3 Fiscal 2017, the total ore mined at the Ying Mining District was 171,303 tonnes, an increase of 13% compared to total ore production of 152,230 tonnes in Q3 Fiscal 2016. Total ore milled at the Ying Mining District in Q3 Fiscal 2017 was 182,259 tonnes, an increase of 21% compared to 151,035 tonnes in Q3 Fiscal 2016. Silver and lead head grades improved by 6% and 16%, respectively, to 303 grams per tonne (“g/t”) for silver and 4.8% for lead from 287 g/t for silver and 4.1% for lead, respectively, in Q3 Fiscal 2016, resulting largely from the ongoing dilution control and operation management improvements. Head grade for zinc was 0.8%, comparable to 0.8% in the prior year quarter.
In Q3 Fiscal 2017, the Ying Mining District sold approximately 1.6 million ounces of silver, 700 ounces of gold, 17.3 million pounds of lead, and 1.2 million pounds of zinc, up 28%, 33%, 43%, and 4% respectively, compared to 1.2 million ounces of silver, 500 ounces of gold, 12.1 million pounds of lead, and 1.2 million pounds of zinc in Q3 Fiscal 2016. The increase in metals sold is mainly due to the improved head grades achieved and higher ore production in the quarter.
Cash mining costs per tonne in Q3 Fiscal 2017 was $55.21, compared to $55.63 in Q3 Fiscal 2016. Cash milling costs in Q3 Fiscal 2017 were $9.09 compared to $11.67 in Q3 Fiscal 2016 with the decrease mainly due to: i) a 15% reduction in per tonne utility costs; ii) a 4% decrease in per tonne labour costs; and iii) the exclusion of mineral resource tax from milling costs. Prior to June 30, 2016, mineral resource tax was levied at RMB¥13.0 per tonne of ore milled and included as part of milling costs. Effective July 1, 2016, the mineral resource tax was changed to a levy based on a certain percentage of sales, and therefore such tax is excluded from milling costs but expensed directly and included in government fee and other taxes.
Cash production cost per tonne of ore processed at the Ying Mining District in Fiscal Q3 2017 was $68.22, a decrease of 4% compared to $71.29 in Q3 Fiscal 2016 as a result of the decrease in both per tonne cash mining and milling costs.
Cash cost per ounce of silver, net of by-product credits, at the Ying Mining District, was negative $4.60 in Q3 Fiscal 2017 compared to $0.25 in Q3 Fiscal 2016. The decrease was mainly due to: i) lower per tonne cash production costs as discussed above; and, ii) a 111% increase in by-product credits arising from 43% and 4% increases in lead and zinc sold and 50% and 67% increases in net realized lead and zinc selling prices. Sales from lead and zinc accounted for 44% of the total sales at the Ying Mining District in the current quarter, and amounted to $17.7 million, an increase of $9.4 million, compared to $8.3 million in the prior year quarter.
All in sustaining costs per ounce of silver, net of by-product credits, at the Ying Mining District in Q3 2017 was $1.34 per ounce of silver compared to $6.62 in Q3 Fiscal 2016. The decrease was mainly due to lower per tonne cash production cost and the increase in by-product credits as discussed above, offset by a $1.2 million increase in sustaining capital expenditures.
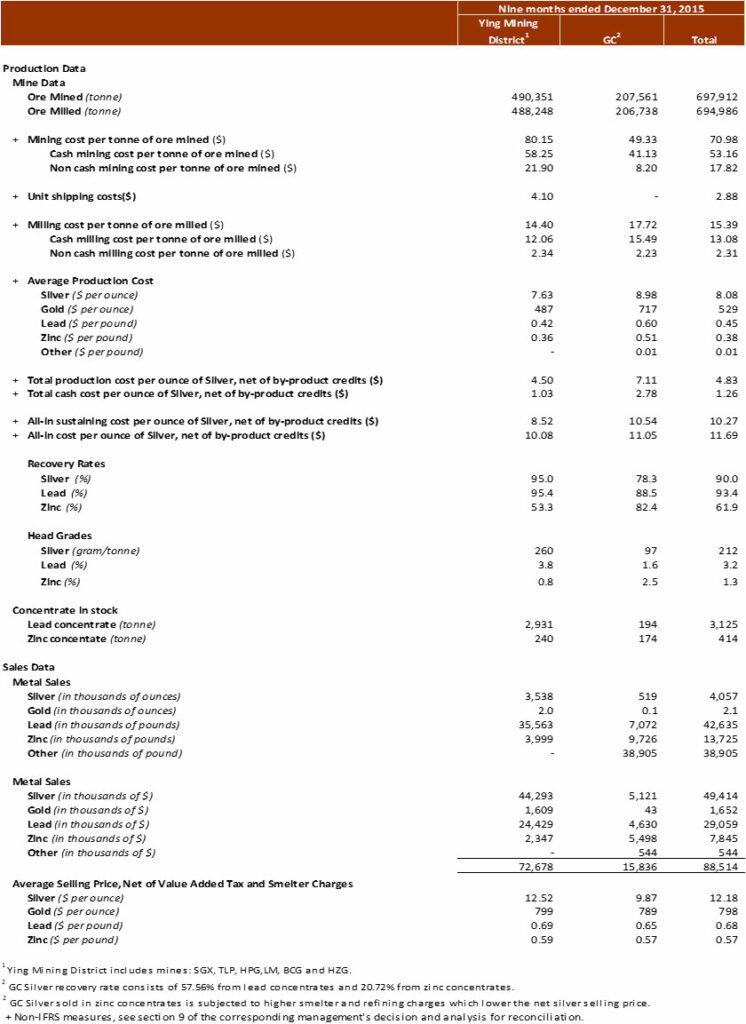
For the nine months ended December 31, 2016, the total ore mined at the Ying Mining District was 524,005 tonnes, up 7% compared to 490,351 tonnes in the same prior year period. Correspondingly, total ore milled was 530,160 tonnes, up 9% compared to 488,248 tonnes. Average head grades were 305 g/t for silver, 4.7% for lead, and 1.0% for zinc compared to 260 g/t for silver, 3.8% for lead, and 0.8% for zinc, respectively.
During the same time periods, the Ying Mining District sold approximately 4.7 million ounces of silver, 2,600 ounces of gold, 49.9 million pounds of lead, and 4.8 million pounds of zinc, compared to 3.5 million ounces of silver, 2,000 ounces of gold, 35.6 million pounds of lead, and 4.0 million pounds of zinc in the same prior year period.
For the nine months ended December 31, 2016, the cash mining costs at the Ying Mining District was $52.18 per tonne, a decrease of 10% compared to $58.25 per tonne in the same prior year period. The cash milling cost was $9.31 per tonne, a decrease of 23% compared to $12.06 in the same prior year period.
Cash cost per ounce of silver and all in sustaining costs per ounce of silver, net of by-product credits, at the Ying Mining District, for the nine months ended December 31, 2016, were negative $2.43 and $3.11 respectively, compared to $1.03 and $8.52 in the same prior year period.
In Q3 Fiscal 2017, approximately 36,756 meters (“m”) of underground diamond drilling (Q3 Fiscal 2016 – 21,223 m) and 4,900 m of preparation tunnelling (Q3 Fiscal 2016 – 4,231 m) were completed and expensed as mining preparation costs at the Ying Mining District. In addition, approximately 17,823 m of horizontal tunnel, raise, and declines (Q3 Fiscal 2016 – 13,893 m) were completed and capitalized. Total capitalized exploration and development expenditures in Q3 Fiscal 2017 for the Ying Mining District were $5.7 million compared to $4.6 million in Q3 Fiscal 2016.
For the nine months ended December 31, 2016, approximately 71,794 m of underground diamond drilling (same prior year period – 60,435 m) and 15,069 m of preparation tunnelling (same prior year period – 16,460 m) were completed and expensed as mining preparation costs at the Ying Mining District. In addition, approximately 50,500 m of horizontal tunnel, raise, and declines (same prior year period – 49,452 m) were completed and capitalized. Total capitalized exploration and development expenditures for the nine months ended December 31, 2016 for the Ying Mining District were $15.4 million compared to $16.4 million in same prior year period. The Company also paid $1.3 million to renew the mining permit for TLP and LM mine and $8.7 million to retire the mineral right fee payable incurred in prior years for the mining permit for the SGX mine.
2. GC Mine, Guangdong Province, China
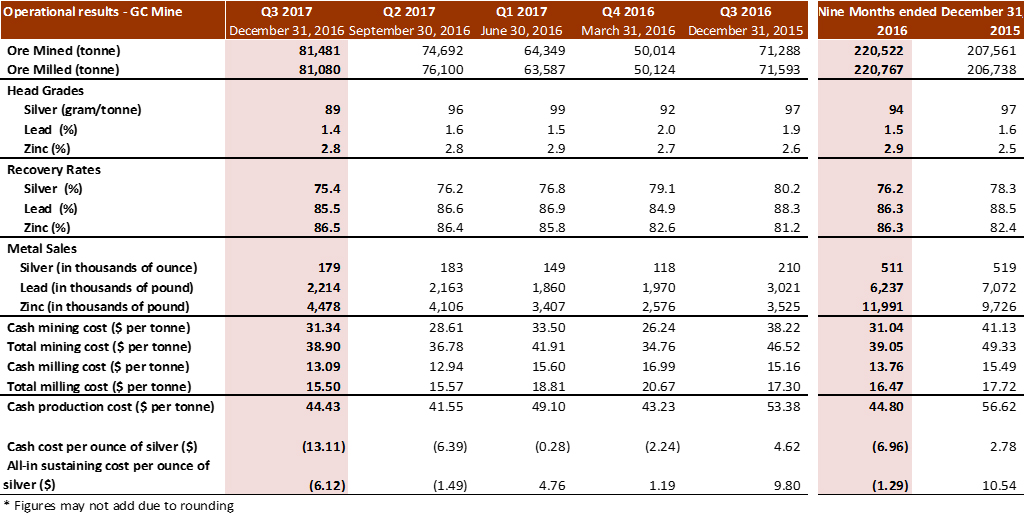
In Q3 Fiscal 2017, the Company mined 81,481 tonnes of ore at the GC Mine, an increase of 14% compared to 71,288 tonnes in Q3 Fiscal 2016. Total ore milled at the GC Mine in Q3 Fiscal 2017 was 81,080 tonnes, an increase of 13% compared to 71,593 tonnes in Q3 Fiscal 2016. Head grades were 89 g/t for silver, 1.4% for lead and 2.8% for zinc, compared to 97 g/t for silver, 1.9% for lead and 2.6% for zinc in Q3 Fiscal 2016.
Cash mining cost was $31.34 in Q3 Fiscal 2017 compared to $38.22 in Q3 Fiscal 2016. The decrease of cash mining costs arose mainly because approximately 29% of the ore was by-product ore from exploration tunnelling or extracted from previously mined stopes for which direct mining costs were paid in prior periods, and the only cost involved was to ship the ore to the mill. The cash milling cost per tonne was $13.09, compared to $15.16 in Q3 Fiscal 2016, with the decrease mainly due to the exclusion of mineral resource tax from milling costs as discussed above.
Correspondingly, cash production cost per tonne of ore processed at the GC Mine was $44.43, a decrease of 17% compared to $53.38 in Q3 Fiscal 2016 as a result of the decrease in both per tonne cash mining and milling cost.
In Q3 Fiscal 2017, the GC Mine sold approximately 4.5 million pounds of zinc, an increase of 27%, compared to 3.5 million pounds of zinc in the prior year quarter as a result of the 6% increase in zinc head grade and higher output. Silver and lead sold at the GC Mine decreased by 15% and 27% to approximately 0.2 million ounces of silver and 2.2 million pounds of lead, respectively, compared to 0.2 million ounces of silver and 3.0 million pounds of lead sold in Q3 Fiscal 2016, with the decrease mainly due to lower head grades and recovery rates.
Cash cost per ounce of silver, net of by-product credits, at the GC Mine, was negative $13.11 in Q3 Fiscal 2017 compared to $4.62 in Q3 Fiscal 2016. The decrease was mainly due to: i) lower per tonne cash production costs as discussed above; and, ii) a 68% increase in by-product credits, mainly arising from more zinc sold and higher lead and zinc prices. Sales from lead and zinc accounted for 75% of the total sales at the GC Mine in the current quarter, and amounted to $5.9 million, an increase of $2.5 million, compared to $3.4 million in the prior year quarter.
All in sustaining costs per ounce of silver, net of by-product credits, at the GC Mine in Q3 2017 was negative $6.12, compared to $9.80 in Q3 Fiscal 2016. The decrease was mainly due to: i) lower per tonne cash production costs and the increase of by-product credits as discussed above; and, ii) a $0.2 million decrease in sustaining capital expenditures.
For the nine months ended December 31, 2016, the total ore mined at the GC Mine was 220,522 tonnes, an increase of 6% compared to 207,561 tonnes in the same prior year period. Correspondingly, total ore milled was 220,767 tonnes, an increase of 7% compared to 206,738 milled in the same prior year period. Average head grades were 94 g/t for silver, 1.5% for lead, and 2.9% for zinc compared to 97 g/t for silver, 1.6% for lead, and 2.5% for zinc, respectively.
During the same time periods, the GC Mine sold approximately 0.5 million ounces of silver, 6.2 million pounds of lead, and 12.0 million pounds of zinc, compared to 0.5 million ounces of silver, 7.1 million pounds of lead, and 9.7 million pounds of zinc in the same prior year period.
For the nine months ended December 31, 2016, the cash mining costs at the GC Mine was $31.04 per tonne, a decrease of 25% compared to $41.13 per tonne in the same prior year period. The cash milling cost was $13.76 per tonne, a decrease of 11% compared to $15.49 in the same prior year period.
Cash cost per ounce of silver and all in sustaining costs per ounce of silver, net of by-product credits, at the GC Mine, for the nine months ended December 31, 2016, were negative $6.96 and negative $1.29 respectively, compared to $2.78 and $10.54 in the same prior year period.
In Q3 Fiscal 2017, approximately 3,935 m of underground diamond drilling (Q3 Fiscal 2016 – 4,202 m) and 4,640 m of tunnelling (Q3 Fiscal 2016 – 4,111 m) were completed and expensed as mining preparation costs at the GC Mine. In addition, approximately 554 m of horizontal tunnel, raise, and declines (Q3 Fiscal 2016 – 731 m) were completed and capitalized. Total capitalized exploration and development expenditures in Q3 Fiscal 2017 for the GC Mine were $0.5 million compared to $0.3 million in Q3 Fiscal 2016.
For the nine months ended December 31, 2016, approximately 9,489 m of underground diamond drilling (same prior year period – 18,500 m) and 11,976 m of tunnelling (same prior year period – 11,847 m) were completed and expensed as mining preparation costs at the GC Mine. In addition, approximately 1,685 m of horizontal tunnel, raise, and declines (same prior year period – 1,239 m) were completed and capitalized. Total capitalized exploration and development expenditures were $0.9 million compared to $0.8 million in the same prior year period.
FISCAL 2018 PRODUCTION AND CASH COST GUIDANCE IMPROVES OVER PRIOR YEAR GUIDANCE
Silvercorp’s Fiscal 2018 guidance, for both production and cash costs, has improved relative to Fiscal 2017 guidance including a 12% increase in silver production guidance, a 10% increase in lead production guidance, and a 44% decrease in consolidated all-in sustaining cost per ounce of silver guidance. The table below sets out more detailed guidance for fiscal 2018.
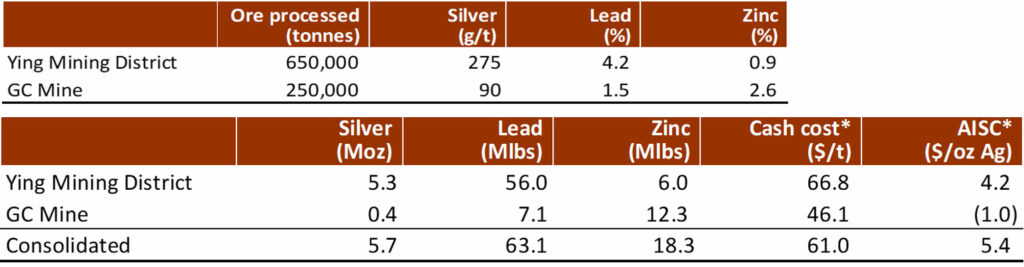
(*)Both AISC and cash cost are non-IFRS measures. AISC refers to all-in sustaining cost per ounce of silver, net of credits from gold, lead, zinc and other metals. Cash cost refers to cash production costs per tonne ore processed. Foreign exchange rates assumptions used are: US$1 = CAD$1.33, US$1 = RMB¥6.85; metal prices assumptions used are US$17/oz for silver, US$1,185/oz for gold, US$0.98/lb for lead, and US$1.07/lb for zinc.
In Fiscal 2018, the Company expects to produce approximately 900,000 tonnes of ore, yielding 5.7 million ounces of silver, 63.1 million pounds of lead, and 18.3 million pounds of zinc. Fiscal 2018 production guidance represents an increase of approximately 5% in ore production, 12% in silver production, and 10% in lead production compared to the prior year’s guidance released on February 5, 2016. The consolidated all-in sustaining cost (“AISC”) is forecasted to be $5.4 per ounce of silver after credits from gold, lead, zinc and other metals, a decline of 44% compared to guidance of $9.67 for Fiscal 2017.
1. Ying Mining District, Henan Province, China
In Fiscal 2018, Ying Mining District plans to mine and process 650,000 tonnes of ore averaging 275 g/t silver, 4.2% lead, and 0.9% zinc with expected metal production of 5.3 million ounces of silver, 56.0 million pounds of lead and 6.0 million of zinc. Fiscal 2018 production guidance at the Ying Mining District represents an increase of approximately 6% in both ore production and silver head grade and an increase of 15% in silver production compared to the prior year’s guidance. The cash production cost is expected to be $66.8 per tonne of ore. All-in sustaining cost per ounce of silver is estimated to be $4.2 per ounce of silver, a decline of 48% compared to guidance of $8.13 for Fiscal 2017.
Capital expenditures at the Ying Mining District in Fiscal 2018 are budgeted at $21.5 million, a decline of 29% compared to guidance of $30.2 million for Fiscal 2017. Fiscal 2018 capital expenditures include sustaining capital expenditures of $19.5 million and other capital expenditures of $2.0 million.
2. GC Mine, Guangdong Province, China
In Fiscal 2018, GC Mine plans to mine and process 250,000 tonnes of ore averaging 90 g/t silver, 1.5% lead and 2.6% zinc with expected metal production of 0.4 million ounces of silver, 7.1 million pounds of lead and 12.3 million pounds of zinc. The cash production cost is expected to be $46.1 per tonne of ore. All in sustaining cash cost at GC Mine is expected to be negative $1.0 per ounce of silver.
Capital expenditures at GC Mine in Fiscal 2018 are budgeted at $1.0 million, which includes sustaining capital expenditures of $0.5 million and other capital expenditures of $0.5 million.
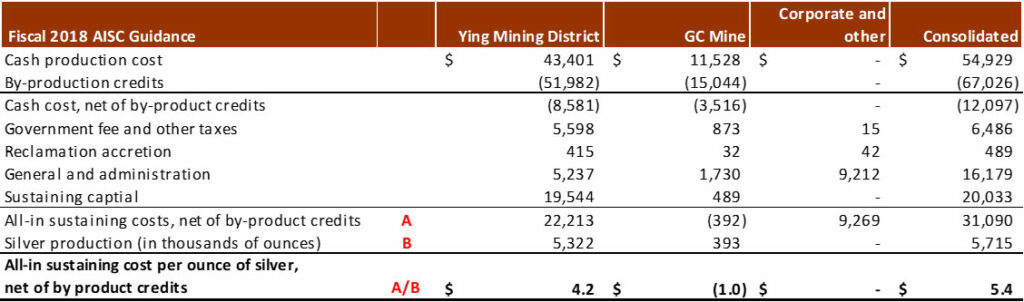
3. Consolidated AISC
Consolidated all-in sustaining cost is estimated to be $5.4 per ounce of silver with the detailed breakdown as follows:
Alex Zhang, P.Geo., Vice President, Exploration, is the Qualified Person for Silvercorp under NI 43-101 and has reviewed and given consent to the technical information contained in this news release.
This earnings release should be read in conjunction with the Company’s Management Discussion & Analysis, Financial Statements and Notes to Financial Statements for the corresponding period, which have been posted on SEDAR at www.sedar.com and are also available on the Company’s website at www.silvercorp.ca. All figures are in United States dollars unless otherwise stated.
About Silvercorp
Silvercorp is a low-cost silver-producing Canadian mining company with multiple mines in China. The Company’s vision is to deliver shareholder value by focusing on the acquisition of under developed projects with resource potential and the ability to grow organically. For more information, please visit our website at www.silvercorp.ca.
For further information
Silvercorp Metals Inc.
Gordon Neal
Vice President, Corporate Development
Phone: (604) 669-9397
Toll Free 1(888) 224-1881
Email: investor@silvercorp.ca
Website: www.silvercorp.ca
CAUTIONARY DISCLAIMER – FORWARD LOOKING STATEMENTS
Certain of the statements and information in this press release constitute “forward-looking statements” within the meaning of the United States Private Securities Litigation Reform Act of 1995 and “forward-looking information” within the meaning of applicable Canadian provincial securities laws. Any statements or information that express or involve discussions with respect to predictions, expectations, beliefs, plans, projections, objectives, assumptions or future events or performance (often, but not always, using words or phrases such as “expects”, “is expected”, “anticipates”, “believes”, “plans”, “projects”, “estimates”, “assumes”, “intends”, “strategies”, “targets”, “goals”, “forecasts”, “objectives”, “budgets”, “schedules”, “potential” or variations thereof or stating that certain actions, events or results “may”, “could”, “would”, “might” or “will” be taken, occur or be achieved, or the negative of any of these terms and similar expressions) are not statements of historical fact and may be forward-looking statements or information. Forward-looking statements or information relate to, among other things: the price of silver and other metals; the accuracy of mineral resource and mineral reserve estimates at the Company’s material properties; the sufficiency of the Company’s capital to finance the Company’s operations; estimates of the Company’s revenues and capital expenditures; estimated production from the Company’s mines in the Ying Mining District; timing of receipt of permits and regulatory approvals; availability of funds from production to finance the Company’s operations; and access to and availability of funding for future construction, use of proceeds from any financing and development of the Company’s properties.
Forward-looking statements or information are subject to a variety of known and unknown risks, uncertainties and other factors that could cause actual events or results to differ from those reflected in the forward-looking statements or information, including, without limitation, risks relating to: fluctuating commodity prices; calculation of resources, reserves and mineralization and precious and base metal recovery; interpretations and assumptions of mineral resource and mineral reserve estimates; exploration and development programs; feasibility and engineering reports; permits and licences; title to properties; property interests; joint venture partners; acquisition of commercially mineable mineral rights; financing; recent market events and conditions; economic factors affecting the Company; timing, estimated amount, capital and operating expenditures and economic returns of future production; integration of future acquisitions into the Company’s existing operations; competition; operations and political conditions; regulatory environment in China and Canada; environmental risks; foreign exchange rate fluctuations; insurance; risks and hazards of mining operations; key personnel; conflicts of interest; dependence on management; internal control over financial reporting as per the requirements of the Sarbanes-Oxley Act; and bringing actions and enforcing judgments under U.S. securities laws.
This list is not exhaustive of the factors that may affect any of the Company’s forward-looking statements or information. Forward-looking statements or information are statements about the future and are inherently uncertain, and actual achievements of the Company or other future events or conditions may differ materially from those reflected in the forward-looking statements or information due to a variety of risks, uncertainties and other factors, including, without limitation, those referred to in the Company’s Annual Information Form for the year ended March 31, 2016 under the heading “Risk Factors”. Although the Company has attempted to identify important factors that could cause actual results to differ materially, there may be other factors that cause results not to be as anticipated, estimated, described or intended. Accordingly, readers should not place undue reliance on forward-looking statements or information.
The Company’s forward-looking statements and information are based on the assumptions, beliefs, expectations and opinions of management as of the date of this press release, and other than as required by applicable securities laws, the Company does not assume any obligation to update forward-looking statements and information if circumstances or management’s assumptions, beliefs, expectations or opinions should change, or changes in any other events affecting such statements or information. For the reasons set forth above, investors should not place undue reliance on forward-looking statements and information.
SILVERCORP METALS INC.
Condensed Consolidated Interim Statements of Financial Position
(Unaudited – Expressed in thousands of U.S. dollars)