VANCOUVER, British Columbia – February 22, 2017 – Silvercorp Metals Inc. (“Silvercorp” or the “Company”) is pleased to report the results of an updated National Instrument (“NI”) 43-101 Technical Report with an effective date of December 31 2016 (Mineral Resources and Mineral Reserves effective June 30 2016), prepared by AMC Mining Consultants (Canada) Ltd. (“AMC”) covering the SGX, HZG, HPG, TLP, LME, and LMW underground mines on the Ying silver-lead-zinc property in Henan Province, China (the “Ying 2017 Technical Report”).
The four authors of the Ying 2017 Technical Report all qualify as independent Qualified Persons. Three of the authors visited the Ying Property in July 2016. AMC examined all aspects of the project, including drill core, exploration sites, underground workings, processing plant and surface infrastructure. The Ying 2017 Technical Report, with a completion date of February 15, 2017, will be made available for review on the SEDAR system and on the Company’s website at www.silvercorp.ca in due course.
The Mineral Resource estimates for the Ying property were made by independent Qualified Person, Dr. Adrienne Ross, P.Geo using Datamine 3-D software.
Highlights of the Ying 2017 Technical Report
- Defined Mineral Reserves of 12.30 million tonnes in the Proven and Probable categories grading 240 grams per tonne (g/t) silver (Ag), 0.07 g/t gold (Au), 3.75% lead (Pb), and 1.27% zinc (Zn), containing 95.02 million oz silver, 27,270 oz gold, 460,960 tonnes lead, and 155,690 tonnes zinc. In comparison with the 2014 Technical Report (Mineral Reserves effective date of June 30, 2013), the increase in total Ying Mineral Reserve metal contents for silver, lead and zinc is 15%, 21% and 22% respectively. This increase is on top of 14.5 million ounces of silver production between July 2013 and June 2016.
- Based on Proven and Probable Reserves only, the Ying mine complex is a viable operation with a projected Life of Mine (LOM) through to 2036, assuming an average annual production rate of approximately 6 million ounces of silver between 2017 and 2025, approximately 4.5 million ounces between 2026 and 2030, and approximately 2.4 million ounces between 2031 and 2036. It also has the potential to extend the LOM beyond 2036, via further exploration and development, particularly in areas of Inferred Resources.
- Reported Mineral Resources of 16.31 million tonnes (inclusive of Mineral Reserves) in the Measured and Indicated categories grading 245 g/t Ag, 0.09 g/t Au, 3.87% Pb, and 1.31% Zn, containing 128.31 million ounces (oz) silver, 47,000 oz gold, 630,600 tonnes lead, and 214,350 tonnes zinc.
- For Measured plus Indicated Resources, tonnes have increased by 16%, grades have increased by between 3% and 7%, and contained metal has increased by 20% for silver, 23% for lead and 24% for zinc.
- For Inferred Resources, tonnes have increased by 39%, silver grades have decreased by 8%, lead grades have increased by 20%, zinc grades have increased by 11%, and contained metal has increased by 28% for silver, 67% for lead and 54% for zinc.
- The results of the 2013-2016 underground drilling program on the Ying Property show that most of the major mineralized vein structures are still open at depth and laterally.
- Based on the LOM production forecast and the metal price and other assumptions shown under ‘Economic Analysis’ below, a base case pre-tax NPV at 8% discount rate of $714M is projected ($535M post-tax). Over the LOM, 63.1% of the net revenue is projected to come from silver, 31.4% from lead and 5.5% from zinc.
2017 Mineral Resource and Mineral Reserve Summary
The last independent Mineral Resource estimate on the property had an effective date of June 30, 2013. Since that time, from July 1, 2013 to June 30, 2016, Silvercorp drilled 855 underground holes and 41 surface holes, for a total of approximately 225,000 m. Most drill core is NQ-sized. Other than drilling, the projects have been explored primarily from underground workings. The workings follow vein structures along strike, on levels spaced approximately 40 m apart. Channel chip samples across the structures are collected at 5 m spacing. From July 1, 2013 to June 30, 2016, Silvercorp undertook 128 km of tunnelling, and collected approximately 44,000 channel/chip samples
Mineral Resources:
The Mineral Resource estimates for the Ying property were prepared by independent Qualified Person, Dr. Adrienne Ross, P.Geo, with the assistance of Ms. Kathy Zunica of AMC and with input from Mr. Pat Stephenson, P.Geo, who takes QP responsibility for the additional geological sections in the 2017 Technical Report. Datamine software was used, and, as a result of a recommendation in AMC’s 2012 Technical Report, the June 2016 Resources were estimated using a block modelling approach, with 3D ordinary kriging and Datamine’s™ dynamic anisotropy application1. Resource estimates were made for a total of 194 mineralized vein structures for the six active mines of the Ying property.
The Mineral Resources are reported above cut-offs after applying a minimum practical extraction width of 0.3 m. Diluted grades were estimated for blocks with mineralization widths less than 0.3 m by adding a waste envelope with zero grade. Cut-off grades are based on in situ values in silver equivalent (AgEq) terms in grams per tonne and incorporate mining, processing, shipping and general & administration (G & A) costs provided by Silvercorp for each mine and reviewed by AMC.
The estimated Mineral Resources and metal content for the property as of June 30, 2016 are detailed in Table 1 below.
Table 1. Ying Mining District – Measured & Indicated, and Inferred Mineral Resources
(Inclusive of Mineral Reserves)
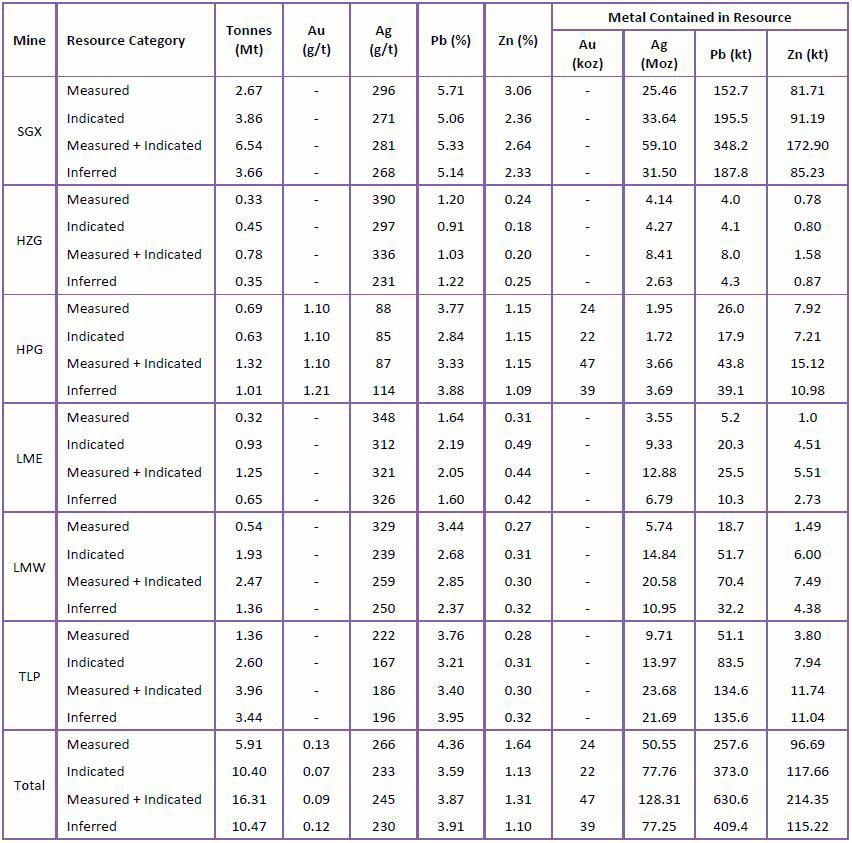
Notes:
Measured and Indicated Mineral Resources are inclusive of Mineral Resources from which Mineral Reserves are estimated
Metal prices: gold US$1250/troy oz, silver US$19/troy oz, lead US$0.90/lb, zinc US$1.00/lb
Exchange rate: RMB 6.50 : US$1.00
Veins factored to minimum extraction width of 0.3 m
Cut-off grades: SGX 140 g/t AgEq; HZG 125 g/t AgEq; HPG 125 g/t AgEq; LME 125 g/t AgEq; LMW 130 g/t AgEq TLP 120 g/t AgEq
Silver equivalent formulas by mine:
| SGX=33.1895*Pb%+23.4590*Zn%+Ag g/t; | HZG=31.8736*Pb%+Ag g/t; |
| HPG=33.9925*Pb%+18.3181*Zn%+55.4773*Au g/t+Ag g/t; | LME=34.0436*Pb%+Ag g/t; |
| TLP=34.1401*Pb%+Ag g/t; | LMW=34.6856*Pb%+Ag g/t; |
Exclusive of mine production to 30 June 2016
Rounding of some figures may lead to minor discrepancies in totals
A comparison of Mineral Resource estimates between June 30, 2013 and June 30, 2016 indicates the following:
- For Measured plus Indicated Resources, tonnes have increased by 16%, grades have increased by between 3% and 7%, and contained metal has increased by 20% for silver, 23% for lead and 24% for zinc.
- For Inferred Resources, tonnes have increased by 39%, silver grades have decreased by 8%, lead grades have increased by 20%, zinc grades have increased by 11%, and contained metal has increased by 28% for silver, 67% for lead and 54% for zinc.
- The main reasons for the differences are Mineral Resource addition and conversion to higher categories arising from drilling and level development, different cut-off grades, and depletion due to mining.
Mineral Reserves
The Mineral Reserve estimates for the Ying property were prepared by Silvercorp under the guidance of independent Qualified Person, Mr H A Smith, P.Eng, who takes QP responsibility for those estimates. The estimated Mineral Reserves and metal content for the property as of June 30, 2016 are detailed in Table 2 below, and are based on the assumption that the current stoping practices of cut and fill, resuing and shrinkage stoping will continue to be predominant. The sub-vertical veins, generally competent ground, reasonably regular vein width, and hand-mining techniques using short rounds, allow a significant degree of selectivity and control in the stoping process. Minimum extraction widths of 0.3 m for resuing and 0.8 m for shrinkage were assumed.
Mining dilution and recovery factors vary from mine to mine and with mining method. Average unplanned dilution factors have been estimated at 17% for both resuing and for shrinkage, while assumed mining recovery factors are 95% for resuing stopes and 92% for shrinkage stopes.
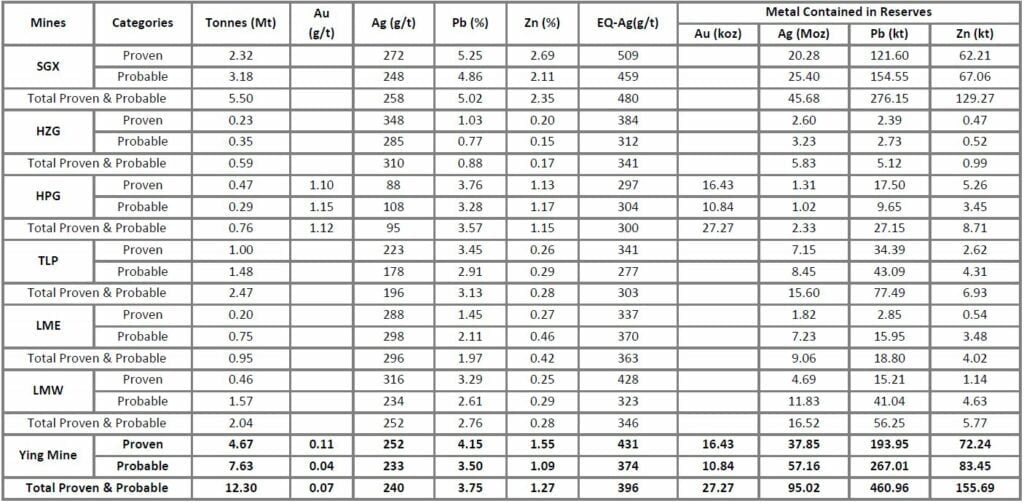
The Ying 2017 Technical Report defines Mineral Reserves of 12.30 million tonnes in the Proven and Probable categories grading 240 g/t Ag, 0.07 g/t Au, 3.75% Pb, and 1.27% Zn, containing 95.02 million oz silver, 27,270 oz gold, 460,960 tonnes lead, and 155,690 tonnes zinc. For the property as a whole, total Mineral Reserve tonnes are noted to be 75% of Mineral Resource (Measured plus Indicated) tonnes. Silver, lead and zinc Mineral Reserve grades are 99%, 97% and 97% respectively of the corresponding Measured plus Indicated Mineral Resource grades. Metal content conversion for silver, lead and zinc is between 73% and 75%.
Table 2. Ying Mining District – Mineral Reserves
Notes to Mineral Reserve Statement:
Stope Cut-off grades (Ag/Eq g/t): SGX – 190 Resuing, 170 Shrinkage; HZG – 170 Resuing; HPG – 200 Resuing, 175 Shrinkage; LME -175 Resuing, 145 Shrinkage; LMW -180 Resuing, 135 Shrinkage; TLP – 155 Resuing, 130 Shrinkage.
Vein development cut-off grades of 50 g/t AgEq for all mines.
Unplanned dilution (zero grade) assumed as 0.05m on each wall of a resuing stope and 0.10m on each wall of a shrinkage stope.
Mining recovery factors assumed as 95% for resuing and 92% for shrinkage.
Metal prices: gold US$1,250/troy oz, silver US$19/troy oz, lead US$0.90/lb, zinc US$1.00/lb
Processing recovery factors: SGX – 94.5% Ag, 96.5% Pb, 61.4% Zn; HZG – 95.6% Ag, 93.8% Pb; HPG – 88.9% Ag, 93.1% Pb, 45.1% Zn; LME – 95.2% Ag, 93.2% Pb; LMW – 93.3% Ag, 95.0% Pb; TLP – 92.4% Ag, 93.5% Pb.
Exclusive of mine production to 30 June 2016.
Exchange rate assumed is RMB 6.90 : US$1.00.
Rounding of some figures may lead to minor discrepancies in totals.
Table 3. Mineral Reserve Cut-off Grades and Key Estimation Parameters
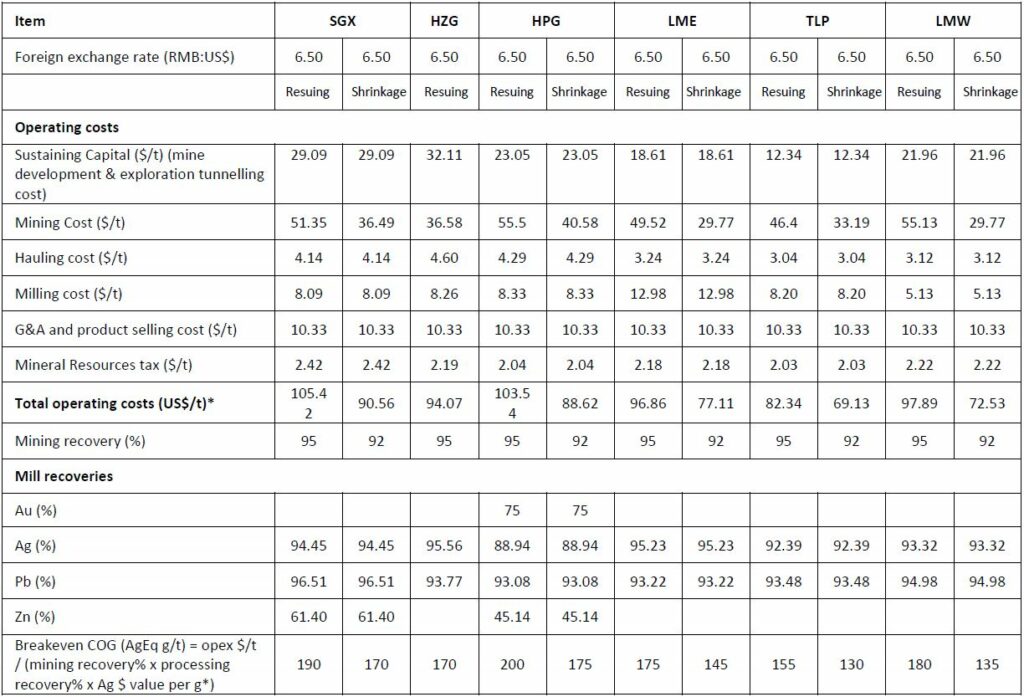
Notes:
Metal price assumptions: Ag $19/oz; Pb $0.90/lb; Zn $1.00/lb.
No Zn value ascribed to ore from HZG, LM, TLP and LMW sites.
Operating costs from 2016 calendar year actuals and projections
A comparison of Mineral Reserve estimates between July 1, 2013 (previous Technical Report) and June 30, 2016 (2017 Technical Report) indicates the following:
- Increase in total Ying Mineral Reserve silver, lead and zinc grades of 18%, 25%, and 26% respectively.
- Increase in total Ying Mineral Reserve metal contents for silver, lead and zinc of 15%, 21% and 22% respectively.
- SGX continues to be the leading contributor to the Ying Mineral Reserves, now accounting for 45% of tonnes, 48% of silver, 60% of lead and 83% of zinc, compared to respective values of 38%, 36%, 43% and 67% in 2013.
- 3% decrease in total Ying Mineral Reserve tonnage.
The Ying mine complex is a viable operation with a projected LOM through to 2036 based on Proven and Probable Reserves. The potential exists for an extended LOM via further exploration and development, particularly in areas of Inferred Resources.
Economic analysis
Although Ying is a producing property and therefore does not require an economic analysis for the purposes of the 2017 Technical Report, AMC believes it is reasonable to include a summary-level analysis to illustrate the potential economic impact relative to the latest Mineral Reserve estimations and to the associated production schedules.
The Ying District is largely a mature operation. A 20-year LOM is envisaged for the resource as currently understood, with average silver equivalent grades projected to be greater than or close to 400 g/t for the first 13 years and then to fall steadily through to the end of mine life. Operating costs and capital costs are anticipated to be reasonable.
For the summary economic analysis, AMC has used the same metal prices as in the Mineral Resource and Mineral Reserve estimation, namely:
- GoldUS$1,250/oz
- SilverUS$19/oz
- LeadUS$0.90/lb
- ZincUS$1.00/lb
An exchange rate of 1US$ = 6.9RMB has been used for the economic analysis.
Based on the LOM production forecast and the metal price and other assumptions shown above, a base case pre-tax NPV at 8% discount rate of $714M is projected ($535M post-tax). Over the LOM, 63.1% of the net revenue is projected to come from silver, 31.4% from lead and 5.5% from zinc.
Qualified Persons
P. R. Stephenson, P.Geo, H. A. Smith, P.Eng, and A. Ross, P.Geo of AMC Mining Consultants (Canada) Ltd. and H. Muller, FAusIMM of AMC Consultants Pty Ltd. are Qualified Persons as defined by National Instrument 43-101. P. R. Stephenson, H. A. Smith, A. Ross, and H. Muller have reviewed and consented to this press release and believe it fairly and accurately represents the information in the Technical Report that supports the disclosure.
Alex Zhang, P. Geo, VP Exploration of the Company, is the Qualified Person on the project as defined under National Instrument 43-101 and he has verified and approved the contents of this news release.
About Silvercorp
Silvercorp is a low-cost silver-producing Canadian mining company with multiple mines in China. The Company’s vision is to deliver shareholder value by focusing on the acquisition of under developed projects with resource potential and the ability to grow organically. For more information, please visit our website at silvercorpmetals.ca
For further information
Gordon Neal
Vice President, Corporate Development
Silvercorp Metals Inc.
Phone: (604) 669-9397
Toll Free: 1(888) 224-1881
Email: investor@silvercorp.ca
Website: http://silvercorpmetals.ca
CAUTIONARY DISCLAIMER – FORWARD LOOKING STATEMENTS
Certain of the statements and information in this press release constitute “forward-looking statements” within the meaning of the United States Private Securities Litigation Reform Act of 1995 and “forward-looking information” within the meaning of applicable Canadian provincial securities laws. Any statements or information that express or involve discussions with respect to predictions, expectations, beliefs, plans, projections, objectives, assumptions or future events or performance (often, but not always, using words or phrases such as “expects”, “is expected”, “anticipates”, “believes”, “plans”, “projects”, “estimates”, “assumes”, “intends”, “strategies”, “targets”, “goals”, “forecasts”, “objectives”, “budgets”, “schedules”, “potential” or variations thereof or stating that certain actions, events or results “may”, “could”, “would”, “might” or “will” be taken, occur or be achieved, or the negative of any of these terms and similar expressions) are not statements of historical fact and may be forward-looking statements or information. Forward-looking statements or information relate to, among other things: the price of silver and other metals; the accuracy of mineral resource and mineral reserve estimates at the Company’s material properties; the sufficiency of the Company’s capital to finance the Company’s operations; estimates of the Company’s revenues and capital expenditures; estimated production from the Company’s mines in the Ying Mining District; timing of receipt of permits and regulatory approvals; availability of funds from production to finance the Company’s operations; and access to and availability of funding for future construction, use of proceeds from any financing and development of the Company’s properties.
Forward-looking statements or information are subject to a variety of known and unknown risks, uncertainties and other factors that could cause actual events or results to differ from those reflected in the forward-looking statements or information, including, without limitation, risks relating to: fluctuating commodity prices; calculation of resources, reserves and mineralization and precious and base metal recovery; interpretations and assumptions of mineral resource and mineral reserve estimates; exploration and development programs; feasibility and engineering reports; permits and licenses; title to properties; property interests; joint venture partners; acquisition of commercially mineable mineral rights; financing; recent market events and conditions; economic factors affecting the Company; timing, estimated amount, capital and operating expenditures and economic returns of future production; integration of future acquisitions into the Company’s existing operations; competition; operations and political conditions; regulatory environment in China and Canada; environmental risks; foreign exchange rate fluctuations; insurance; risks and hazards of mining operations; key personnel; conflicts of interest; dependence on management; internal control over financial reporting as per the requirements of the Sarbanes-Oxley Act; and bringing actions and enforcing judgments under U.S. securities laws.
This list is not exhaustive of the factors that may affect any of the Company’s forward-looking statements or information. Forward-looking statements or information are statements about the future and are inherently uncertain, and actual achievements of the Company or other future events or conditions may differ materially from those reflected in the forward-looking statements or information due to a variety of risks, uncertainties and other factors, including, without limitation, those referred to in the Company’s Annual Information Form for the year ended March 31, 2016 under the heading “Risk Factors”. Although the Company has attempted to identify important factors that could cause actual results to differ materially, there may be other factors that cause results not to be as anticipated, estimated, described or intended. Accordingly, readers should not place undue reliance on forward-looking statements or information.
The Company’s forward-looking statements and information are based on the assumptions, beliefs, expectations and opinions of management as of the date of this press release, and other than as required by applicable securities laws, the Company does not assume any obligation to update forward-looking statements and information if circumstances or management’s assumptions, beliefs, expectations or opinions should change, or changes in any other events affecting such statements or information. For the reasons set forth above, investors should not place undue reliance on forward-looking statements and information.
1 Dynamic anisotropy re-orientates the search ellipsoid for each estimated block based on the local orientation of the mineralization