VANCOUVER, British Columbia – November 7, 2018 – Silvercorp Metals Inc. (“Silvercorp” or the “Company”) (TSX: SVM) (NYSE American: SVM) reported its financial and operating results for the second quarter ended September 30, 2018 (“Q2 Fiscal 2019”). All amounts are expressed in US Dollars.
Q2 FISCAL YEAR 2019 HIGHLIGHTS
- Sales of $48.1 million, up 1% compared to $47.5 million in the prior year quarter;
- Sold approximately 1.9 million ounces of silver, 1,000 ounces of gold, and 19.4 million pounds of lead, up by 17%, 25%, and 15%, respectively, compared to 1.6 million ounces of silver, 800 ounces of gold, 16.9 million pounds of lead in the prior year quarter while zinc sold was 4.9 million pounds, down 12% compared to 5.6 million pounds in the prior year quarter. The ending inventories of silver-lead concentrate were 3,732 tonnes (containing approximately 0.4 million ounces of silver and 4.3 million pounds of lead), a decrease of 34%, compared to 5,650 tonnes of silver-lead concentrate inventories as at June 30, 2018;
- Gross profit margin of 47% compared to 54% in the prior year quarter, with the decrease mainly due to lower metal prices;
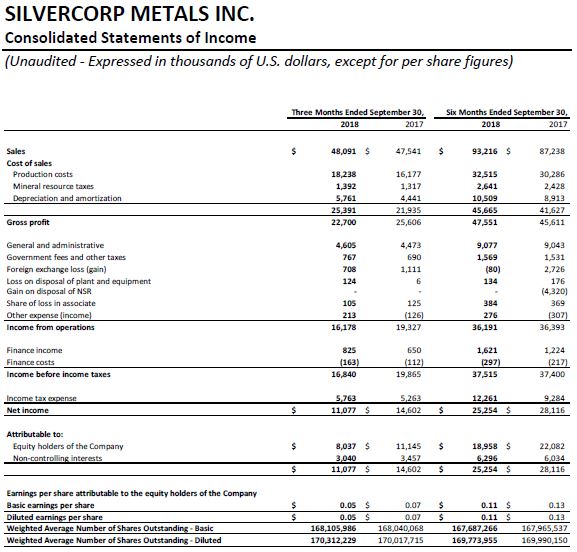
- Net income attributable to equity shareholders of $8.0 million, or $0.05 per share, compared to net income attributable to equity shareholders of $11.1 million, or $0.07 per share in the prior year quarter;
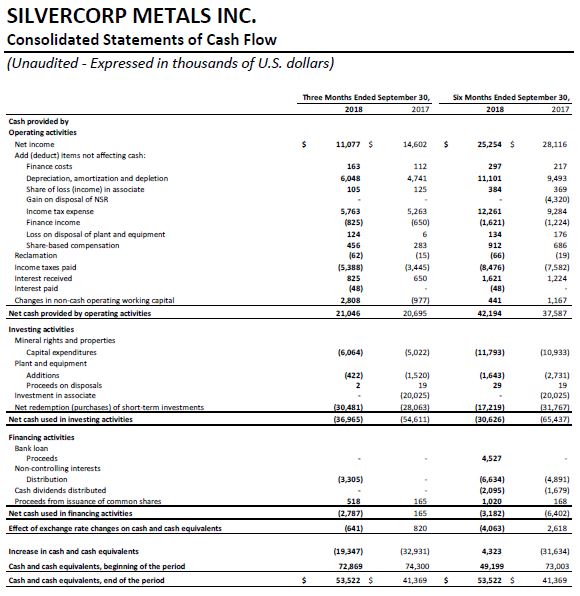
- Cash flow from operations of $21.0 million, up 1% compared to $20.7 million in the prior year quarter;
- Cash cost per ounce of silver1, net of by-product credits, of negative $3.37, compared to negative $5.16 in the prior year quarter; All-in sustaining cost per ounce of silver1, net of by-product credits, of $2.54, compared to $2.26 in the prior year quarter;
- Paid $1.1 million withholding tax at 10% rate for dividend distributed out of China to the Company, compared to $nil in the prior year quarter; and,
- Ended the quarter with $123.9 million in cash and cash equivalents and short-term investments, an increase of $9.1 million or 8% compared to $114.8 million as at June 30, 2018.
FINANCIALS
Net income attributable to equity shareholders of the Company in Q2 Fiscal 2019 was $8.0 million, or $0.05 per share, compared to $11.1 million, or $0.07 per share in the three months ended September 30, 2017 (“Q2 Fiscal 2018”).
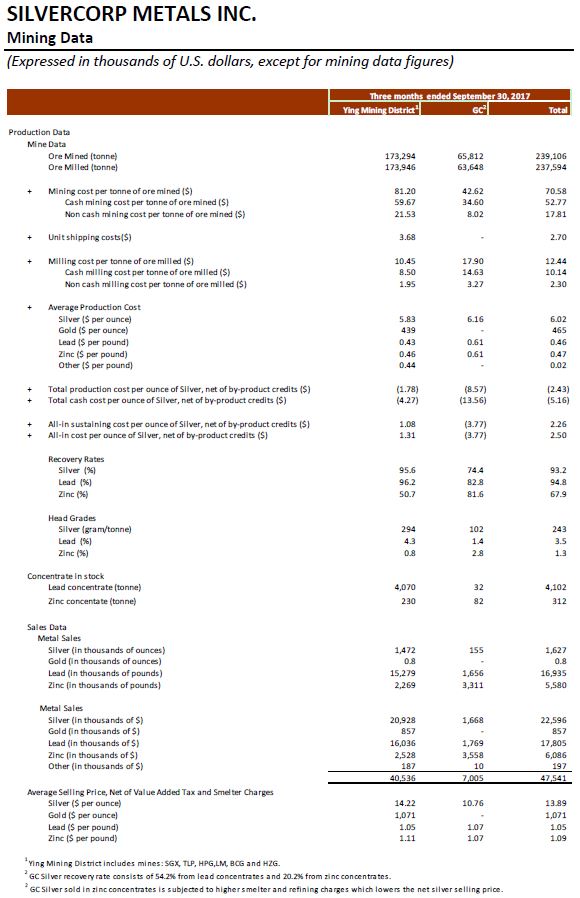
Sales in Q2 Fiscal 2019 were $48.1 million, up 1% compared to $47.5 million in Q2 Fiscal 2018. Silver and gold sales represented $23.4 million and $1.0 million, respectively, while base metals represented $23.6 million of total sales, compared to silver, gold and base metals sales of $22.6 million, $0.9 million, and $24.1 million, respectively, in Q2 Fiscal 2018.
The Company’s financial results in Q2 Fiscal 2019 were mainly impacted by i) a decrease of 11%, 4%, 8%, and 18% in the realized selling prices for silver, gold, lead and zinc, respectively compared to Q2 Fiscal 2018, and ii) an increase of 17% and 15% of silver and lead sold.
Cost of sales in Q2 Fiscal 2019 was $25.4 million compared to $21.9 million in Q2 Fiscal 2018. The cost of sales included $18.2 million (Q2 Fiscal 2018 – $16.2 million) cash production costs, $1.4 million mineral resources tax (Q2 Fiscal 2018 – $1.3 million), and $5.8 million (Q2 Fiscal 2018 – $4.4 million) depreciation and amortization charges. The increase in cash production costs and depreciation and amortization charges was mainly due to more metals sold in the current quarter while the increase in mineral resources tax was due to higher sales achieved in Q2 Fiscal 2019. The cash production costs expensed in cost of sales represent approximately 275,000 tonnes of ore processed and expensed at costs of $66.33 per tonne (Q2 Fiscal 2018 – approximately 246,600 tonnes at $65.61 per tonne)
Gross profit margin in Q2 Fiscal 2019 was 47%, compared to 54% in Q2 Fiscal 2018, with the decrease mainly due to the decrease in metal selling prices. Ying Mining District’s gross profit margin was 50% compared to 56% in Q2 Fiscal 2018. GC Mine’s gross profit margin was 29% compared to 40% in Q2 Fiscal 2018.
General and administrative expenses in Q2 Fiscal 2019 were $4.6 million, a slight increase compared to $4.5 million in Q2 Fiscal 2018. Excluding non-cash share-based compensation and amortization expense, general and administrative expenses in Q2 Fiscal 2019 were $3.9 million, comparable to $3.9 million in Q2 Fiscal 2018.
Income tax expenses in Q2 Fiscal 2019 were $5.8 million compared to $5.3 million in Q2 Fiscal 2018. The income tax expense recorded in Q2 Fiscal 2019 included current income tax expense of $5.1 million (Q2 Fiscal 2018 – $4.5 million) and deferred income tax expense of $0.7 million (Q2 Fiscal 2018 – $1.0 million). The current income tax expenses include $1.1 million withholding tax (Q2 Fiscal 2018 –$nil), being 10% of the dividends distributed out of China to the Company by the Company’s Chinese subsidiaries.
Cash flows provided by operating activities in Q2 Fiscal 2019 were $21.0 million, a slight increase compared to $20.7 million in Q2 Fiscal 2018.
For the six months ended September 30, 2018, net income attributable to equity shareholders of the Company was $19.0 million or $0.11 per share, an effective increase of $1.2 million or 7% over the same prior year period, which was $17.8 million or $0.10 per share after excluding a one-time gain on the sale of a Net Smelter Royalty, which increased the actual net income to shareholders to $22.1 million or $0.13 per share in the same prior year period; sales were $93.2 million, up 7% from $87.2 million in the same prior year period; and cash flows from operating activities were $42.2 million, up 12% from $37.6 million in the same prior year period.
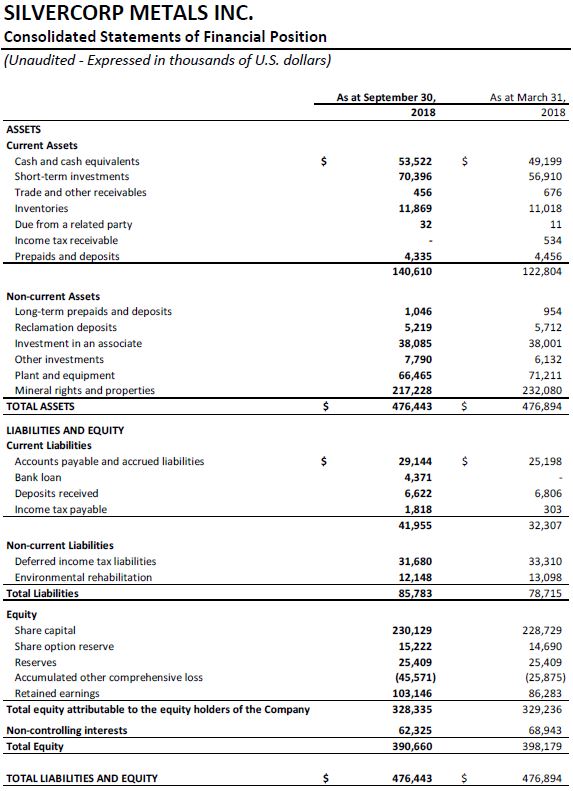
The Company ended the period with $123.9 million in cash and short-term investments, an increase of $9.1 million or 8% compared to $114.8 million as at June 30, 2018.
Working capital as at September 30, 2018 was $98.7 million, an increase of $4.5 million or 5%, compared to $94.2 million working capital as at June 30, 2018.
OPERATIONS AND DEVELOPMENT
1) Q2 Fiscal 2019 vs. Q2 Fiscal 2018
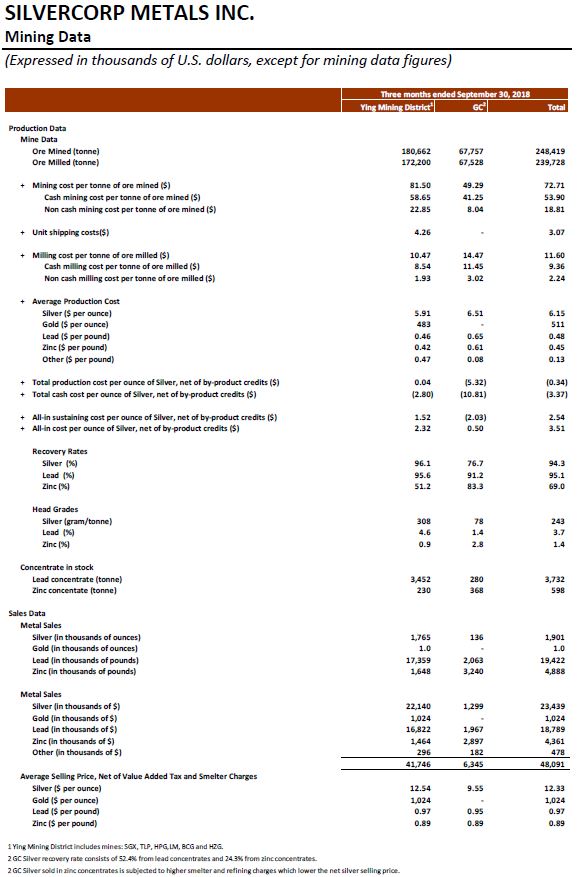
In Q1 Fiscal 2019, on a consolidated basis, the Company mined 248,419 tonnes of ore, an increase of 4% or 9,313 tonnes, compared to 239,106 tonnes in Q2 Fiscal 2018. Ore mined at the Ying Mining District increased by 4% or 7,368 tonnes, and ore mined at the GC Mine increased by 3% or 1,945 tonnes. Ore milled were 239,728 tonnes, up 1% compared to 237,594 tonnes of ore milled in Q2 Fiscal 2018. Ending stockpiled ore inventory as at September 30, 2018 was 21,362 tonnes, up 75% compared to 12,234 tonnes as at March 31, 2018.
In Q2 Fiscal 2019, the Company sold approximately 1.9 million ounces of silver, 1,000 ounces of gold, and 19.4 million pounds of lead, up by 17%, 25%, and 15%, respectively, compared to 1.6 million ounces of silver, 800 ounces of gold, 16.9 million pounds of lead in Q2 Fiscal 2018 while zinc sold was 4.9 million pounds, down 12% compared to 5.6 million pounds in Q2 Fiscal 2018. As at September 30, 2018, inventories of silver-lead concentrate were 3,732 tonnes and zinc concentrate inventories were 598 tonnes, compared to inventories of 4,070 tonnes of silver-lead concentrate and 370 tonnes of zinc concentrate as at March 31, 2018.
In Q2 Fiscal 2019, the consolidated total mining costs and cash mining costs were $72.71 and $53.90 per tonne, compared to $70.58 and $52.77 per tonne, respectively, in Q2 Fiscal 2018. The 2% increase in the cash mining costs per tonne comparing to Q2 Fiscal 2018 was mainly due to more tunnelling expensed at the GC Mine in the current quarter. The consolidated total milling costs and cash milling costs in Q2 Fiscal 2019 were $11.60 and $9.36 per tonne, down 7% and 8% compared to $12.44 and $10.14 per tonne, respectively, in Q2 Fiscal 2018.
Correspondingly, the consolidated total and cash production costs per tonne of ore processed in Q2 Fiscal 2019 increased slightly by 2% and 1% to $87.38 and $66.33, respectively, from $85.72 and $65.61 in Q2 Fiscal 2018, but the consolidated cash production costs per tonne is 6% lower than the annual guidance of $70.20.
In Q2 Fiscal 2019, the consolidated total production costs and cash costs per ounce of silver, net of by-product credits, were negative $0.34 and negative $3.37 compared to negative $2.43 and negative $5.16 respectively in Q2 Fiscal 2018. The increase in the cash cost per ounce of silver, net of by-product credits, is mainly due to a 14% decrease in by-product credits per ounce of silver, mainly arising from 8% and 18% decrease in the realized lead and zinc selling price. Sales from lead and zinc accounted for 48% of the total sales and amounted to $23.2 million, a decrease of $0.7 million, compared to $23.9 million in the Q2 Fiscal 2018.
The consolidated all-in sustaining cost per ounce of silver, net of by-product credits is $2.54 compared to $2.26 in Q2 Fiscal 2018.
2) Six months ended September 30, 2018 vs. Six months ended September 30, 2017
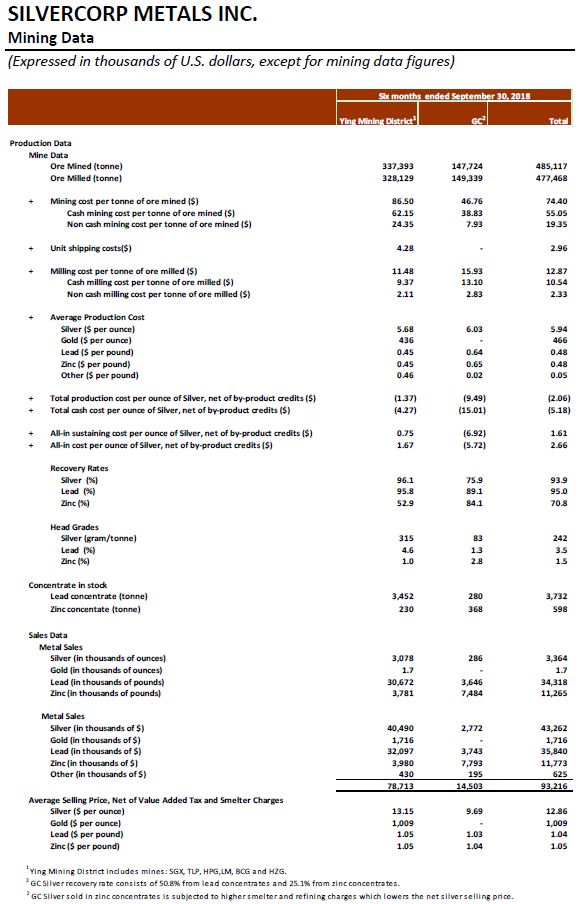
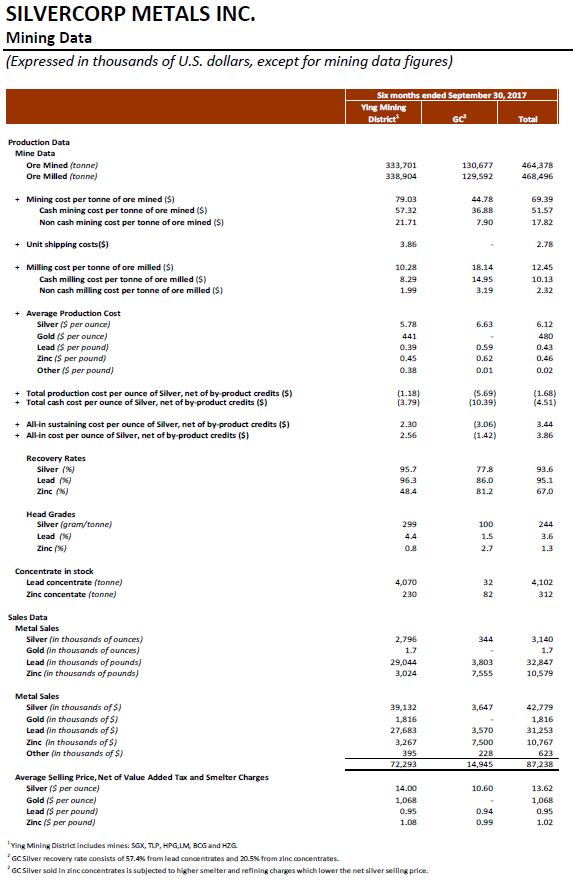
For the six months ended September 30, 2018, on a consolidated basis, the Company mined 485,117 tonnes of ore, an increase of 4% or 20,739 tonnes, compared to 464,378 tonnes mined in the same prior year period. In the same comparative period, ore milled increased 2% to 477,468 tonnes compared to 468,496 tonnes.
For the six months ended September 30, 2018, the Company sold approximately 3.4 million ounces of silver, 1,700 ounces of gold, 34.3 million pounds of lead, and 11.3 million pounds of zinc, compared to 3.1 million ounces of silver, 1,700 ounces of gold, 32.8 million of lead, and 10.6 million pounds of zinc sold in the same prior year period.
The consolidated total mining and cash mining costs were $74.40 and $55.05 per tonne, an increase of 7% and 7%, compared to $69.39 and $51.57 per tonne in the same prior year period while the consolidated total milling cost and cash milling cost were $12.87 and $10.54, an increase of 3% and 4%, respectively, compared to $12.45 and $10.13 per tonne in the same prior year period.
The consolidated total production costs and cash production costs per tonne of ore processed for the six months ended September 30, 2018 were $90.23 and $68.55, an increase of 7% and 6%, respectively, compared to $84.62 and $64.48 in the same prior year period, but the consolidated cash production costs per tonne is 2% lower than the annual guidance of $70.20.
The consolidated cash production costs and all-in sustaining costs per ounce of silver, net of by-product credits, were negative $5.18 and $1.61 compared to negative $4.51 and $3.44, respectively, in the same prior year period.
1. Ying Mining District, Henan Province, China
1) Q2 Fiscal 2019 vs. Q2 Fiscal 2018
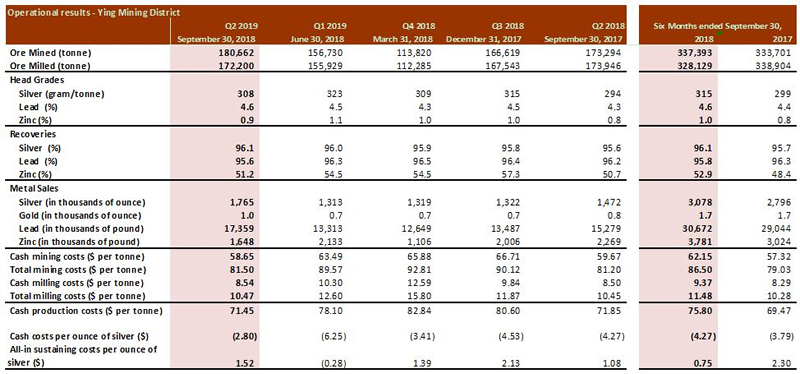
In Q2 Fiscal 2019, the total ore mined at the Ying Mining District was 180,662 tonnes, an increase of 4% or 7,368 tonnes, compared to 173,294 tonnes mined in Q2 Fiscal 2018. Ore milled was 172,200 tonnes, a decrease of 1% or 1,746 tonnes compared to 173, 946 tonnes in Q2 Fiscal 2018. As at September 30, 2018, stockpile ore at the Ying Mining District was 19,269 tonnes, an increase of 10,742 tonnes compared to 8,257 tonnes as at March 31, 2018.
Head grades of ore milled at the Ying Mining District in Q2 Fiscal 2019 were 308 grams per tonne (“g/t”) for silver, 4.6% for lead, and 0.9% for zinc, compared to 294 g/t for silver, 4.3% for lead and 0.8% for zinc in Q2 Fiscal 2018. The Company continues to achieve good dilution control using its “Enterprise Blog” to assist and manage daily operations.
In Q2 Fiscal 2019, the Ying Mining District sold approximately 1.8 million ounces silver, 17.4 million pounds lead, and 1.6 million pounds zinc, compared to 1.5 million ounces silver, 15.3 million pounds lead, and 2.3 million pounds of zinc in Q2 Fiscal 2018. As at September 30, 2018, inventories of silver-lead concentrate at the Ying Mining District were 3,452 tonnes and zinc concentrate inventories were 230 tonnes, compared to inventories of 4,050 tonnes of silver-lead concentrate and 350 tonnes of zinc concentrate as at March 31, 2018.
Total and cash mining costs per tonne at the Ying Mining District in Q2 Fiscal 2019 were $81.50 and $58.65 per tonne, respectively, comparable to $81.20 and $59.67 per tonne in Q2 Fiscal 2018. Total and cash milling costs per tonne at the Ying Mining District in Q2 Fiscal 2019 were $10.47 and $8.54, also comparable to $10.45 and $8.50 in Q2 Fiscal 2018.
Correspondingly, the total production costs and cash production costs per tonne of ore processed in Q2 Fiscal 2019 at the Ying Mining District were $96.23 and $71.45, compared to $95.33 and $71.85 in Q2 Fiscal 2018, and the cash production costs of $71.45 per tonne is 5% lower than the annual guidance of $75.40.
Cash cost per ounce of silver, net of by-product credits, in Q2 Fiscal 2019 at the Ying Mining District, was negative $2.80 compared to negative $4.27 in the prior year quarter. The increase in the cash cost per ounce of silver, net of by-product credits, is mainly due to a 15% decrease in by-product credits per once of silver, mainly arising from 8% and 20% decreases in lead and zinc realized selling price. All in sustaining costs per ounce of silver, net of by-product credits, in Q2 Fiscal 2019 at the Ying Mining District was $1.52 compared to $1.08 in the prior year quarter. The increase was mainly due to the cash cost per ounce of silver, net of by-product credits as discussed above.
In Q2 Fiscal 2019, approximately 22,672 metres or $0.5 million worth of underground diamond drilling (Q2 Fiscal 2018 – 29,834 metres or $0.6 million) and 5,376 metres or $1.7 million worth of preparation tunnelling (Q2 Fiscal 2018 – 6,390 metres or $1.9 million) were completed and expensed as mining preparation costs at the Ying Mining District. In addition, approximately 18,634 metres or $6.0 million worth of horizontal tunnels, raises, ramps and declines (Q2 Fiscal 2018 – 16,958 metres or $5.2 million) were completed and capitalized.
2) Six months ended September 30, 2018 vs. Six months ended September 30, 2017
For the six months ended September 30, 2018, a total of 337,393 tonnes of ore were mined at the Ying Mining District, an increase of 1% or 3,692 tonnes compared to 333,701 tonnes mined in the same prior year period. Ore milled was 328,129 tonnes, down 3% or 10,775 tonnes compared to 338,904 tonnes in the same prior year period. Average head grades of ore processed were 315 g/t for silver, 4.6% for lead, and 1.0% for zinc compared to 299 g/t for silver, 4.4% for lead, and 0.8% for zinc, respectively, in the same prior year period.
During the same time periods, the Ying Mining District sold approximately 3.1 million ounces of silver, 1,700 ounces of gold, 30.7 million pounds of lead, and 3.8 million pounds of zinc, compared to 2.8 million ounces of silver, 1,700 ounces of gold, 29.0 million pounds of lead, and 3.0 million pounds of zinc in prior year period.
For the six months ended September 30, 2018, the cash mining costs and cash milling costs at the Ying Mining District were $62.15 per tonne and $9.37 per tonne, an increase of 8% and 13%, respectively, compared to $57.32 and $8.29 in the same prior year period. The cash production costs were $75.80 per tonne, slightly higher than the annual guidance of $75.40.
Cash cost per ounce of silver and all in sustaining costs per ounce of silver, net of by‐product credits, at the Ying Mining District, for the six months ended September 30, 2018, were negative $4.27 and $0.75 respectively, compared to negative $3.79 and $2.30 in the same prior year period.
For the six months ended September 30, 2018, approximately 49,521 metres or $1.1 million worth of underground diamond drilling (same prior year period – 60,898 metres or $1.3 million) and 10,917 metres or $3.0 million worth of preparation tunnelling (same prior year period – 11,727 metres or $3.3 million) were completed and expensed as mining preparation costs at the Ying Mining District. In addition, approximately 35,562 metres or $12.5 million worth of horizontal tunnels, raises, and declines (same prior year period – 35,848 metres or $10.2 million) were completed and capitalized.
2. GC Mine, Guangdong Province, China
1) Q2 Fiscal 2019 vs. Q2 Fiscal 2018
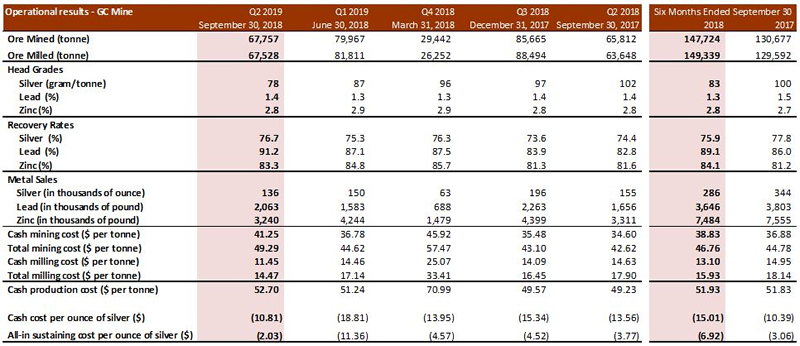
In Q2 Fiscal 2019, the total ore mined at the GC Mine was 67,757 tonnes, an increase of 3% or 1,945 tonnes, compared to 65,812 tonnes mined in Q2 Fiscal 2018, while ore milled was 67,528 tonnes, an increase of 6% or 3,880 tonnes compared to 63,648 tonnes in Q2 Fiscal 2018. Average head grades of ore processed at the GC Mine were 78 g/t for silver, 1.4% for lead, and 2.8% for zinc compared to 102 g/t for silver, 1.4% for lead, and 2.8% for zinc in the prior year quarter.
In Q2 Fiscal 2019, the GC Mine sold 136 thousand ounces of silver, 2.1 million pounds of lead, and 3.2 million pounds of zinc, compared to 155 thousand ounces of silver, 1.7 million pounds of lead, and 3.3 million pounds of zinc sold in the prior year quarter. The decrease in metals sold at the GC Mine was mainly due to the increase in ending concentrate inventories. As at September 30, 2018, inventories of silver-lead concentrates were 280 tonnes and zinc concentrates were 368, compared to inventories of 20 tonnes of silver-lead concentrate and 20 tonnes of zinc concentrate as at March 31, 2018.
Total and cash mining costs per tonne at the GC Mine in Q2 Fiscal 2019 were $49.29 and $41.25 per tonne, compared to $42.62 and $34.60 per tonne in Q2 Fiscal 2018. The increase in cash mining costs was mainly due to a $0.3 million increase in mining preparation costs resulting from more underground drilling and tunnelling expensed in the current quarter. Total and cash milling costs per tonne at the GC Mine in Q2 Fiscal 2019 were $14.47 and $11.45, a decrease of 19% and 22%, respectively, compared to $17.90 and $14.63, respectively, in Q2 Fiscal 2018.
Correspondingly, the total production costs and cash production costs per tonne of ore processed in Q2 Fiscal 2019 at the GC Mine were $63.76 and $52.70, an increase of 5% and 7%, respectively, compared to $60.52 and $49.23 in the prior year quarter, and cash production costs per tonne is 8% lower than the annual guidance of $57.20.
Cash costs per ounce of silver, net of by-product credits, at the GC Mine, was negative $10.81 compared to negative $13.56 in the prior year quarter. The increase was mainly due to a $0.3 million or 11% increase cash production costs expensed into cost of sales and a $0.3 million or 5% decrease in by-product credits mainly resulting from an 11% and 17% decrease in net realized lead and zinc selling prices at the GC Mine.
All in sustaining costs per ounce of silver, net of by-product credits, in Q2 Fiscal 2019 at the GC Mine was negative $2.03 compared to negative $3.77 in the prior year quarter, and the increase was mainly due to the higher cash costs per ounce of silver, net of by-product credits as discussed above.
In Q2 Fiscal 2019, approximately 7,355 metres or $0.3 million worth of underground diamond drilling (Q2 Fiscal 2018 – 5,511 metres or $0.2 million) and 5,243 metres or $1.4 million worth of tunnelling (Q2 Fiscal 2018 – 3,940 metres or $1.1 million) were completed and expensed as mining preparation costs at the GC Mine. In addition, approximately 241 metres or $0.2 million of horizontal tunnels raises and declines (Q2 Fiscal 2018 – 105 metres or $0.1 million) were completed and capitalized.
2) Six months ended September 30, 2018 vs. Six months ended September 30, 2017
For the six months ended September 30, 2018, a total of 147,724 tonnes of ore were mined and 149,339 tonnes were milled at the GC Mine, compared to 130,677 tonnes mined and 129,592 tonnes milled in the same prior year period. Average head grades of ore milled were 83 g/t for silver, 1.3% for lead, and 2.8% for zinc, compared to 100 g/t for silver, 1.5% for lead, and 2.7% for zinc, respectively, in the same prior year period.
During the same time periods, the GC Mine sold approximately 286 thousand ounces of silver, 3.6 million pounds of lead, and 7.5 million pounds of zinc, compared to 344 thousand ounces of silver, 3.8 million pounds of lead, and 7.6 million pounds of zinc in the same prior year period.
For the six months ended September 30, 2018, the cash mining costs at the GC Mine was $38.83 per tonne, an increase of 5% compared to $36.88 per tonne in the same prior year period. The increase in the cash mining costs was mainly due to a $0.7 million increase in mining preparation as more underground drilling and tunnelling was expensed in the current period. The cash milling costs was $13.10 per tonne, a decrease of 12% compared to $14.95 in the same prior year period. Correspondingly, the total production costs and cash production costs per tonne at the GC Mine were $62.69 and $51.93, comparable to $62.92 and $51.83 in the prior year period, but the cash production costs per tonne is 9% lower than the annual guidance of $57.20.
Cash costs per ounce of silver and all in sustaining costs per ounce of silver, net of by‐product credits, at the GC Mine, for the six months ended September 30, 2018, were negative $15.01 and negative $6.92 respectively, compared to negative $10.39 and negative $3.06 in the same prior year period.
For the six months ended September 30, 2018, approximately 14,774 metres or $0.7 million worth of underground diamond drilling (same prior year period – 10,483 metres or $0.5 million) and 10,484 metres or $3.0 million of tunnelling (same prior year period – 9,232 metres or $2.4 million) were completed and expensed as mining preparation costs at the GC Mine. In addition, approximately 779 metres or $0.7 million of horizontal tunnels, raise, and declines (same prior year period – 263 metres or $0.2 million) were completed and capitalized.
Mr. Guoliang Ma, P.Geo., Manager of Exploration and Resources of the Company, is the Qualified Person for Silvercorp under NI 43-101 and has reviewed and given consent to the technical information contained in this news release.
This earnings release should be read in conjunction with the Company’s Management Discussion & Analysis, Financial Statements and Notes to Financial Statements for the corresponding period, which have been posted on SEDAR under the Company’s profile at www.sedar.com and are also available on the Company’s website at www.silvercorp.ca. All figures are in United States dollars unless otherwise stated.
About Silvercorp
Silvercorp is a low-cost silver-producing Canadian mining company with multiple mines in China. The Company’s vision is to deliver shareholder value by focusing on the acquisition of underdeveloped projects with resource potential and the ability to grow organically. For more information, please visit our website at www.silvercorp.ca.
For further information
Silvercorp Metals Inc.
Lon Shaver
Vice President
Phone: (604) 669-9397
Toll Free 1(888) 224-1881
Email: investor@silvercorp.ca
Website: www.silvercorp.ca
CAUTIONARY DISCLAIMER – FORWARD-LOOKING STATEMENTS
Certain of the statements and information in this news release constitute “forward-looking statements” within the meaning of the United States Private Securities Litigation Reform Act of 1995 and “forward-looking information” within the meaning of applicable Canadian provincial securities laws (collectively, “forward-looking statements”). Any statements or information that express or involve discussions with respect to predictions, expectations, beliefs, plans, projections, objectives, assumptions or future events or performance (often, but not always, using words or phrases such as “expects”, “is expected”, “anticipates”, “believes”, “plans”, “projects”, “estimates”, “assumes”, “intends”, “strategies”, “targets”, “goals”, “forecasts”, “objectives”, “budgets”, “schedules”, “potential” or variations thereof or stating that certain actions, events or results “may”, “could”, “would”, “might” or “will” be taken, occur or be achieved, or the negative of any of these terms and similar expressions) are not statements of historical fact and may be forward-looking statements. Forward-looking statements relate to, among other things: the price of silver and other metals; the accuracy of mineral resource and mineral reserve estimates at the Company’s material properties; the sufficiency of the Company’s capital to finance the Company’s operations; estimates of the Company’s revenues and capital expenditures; estimated production from the Company’s mines in the Ying Mining District; timing of receipt of permits and regulatory approvals; availability of funds from production to finance the Company’s operations; and access to and availability of funding for future construction, use of proceeds from any financing and development of the Company’s properties.
Forward-looking statements are subject to a variety of known and unknown risks, uncertainties and other factors that could cause actual events or results to differ from those reflected in the forward-looking statements, including, without limitation, risks relating to: fluctuating commodity prices; calculation of resources, reserves and mineralization and precious and base metal recovery; interpretations and assumptions of mineral resource and mineral reserve estimates; exploration and development programs; feasibility and engineering reports; permits and licences; title to properties; property interests; joint venture partners; acquisition of commercially mineable mineral rights; financing; recent market events and conditions; economic factors affecting the Company; timing, estimated amount, capital and operating expenditures and economic returns of future production; integration of future acquisitions into the Company’s existing operations; competition; operations and political conditions; regulatory environment in China and Canada; environmental risks; foreign exchange rate fluctuations; insurance; risks and hazards of mining operations; key personnel; conflicts of interest; dependence on management; internal control over financial reporting; and bringing actions and enforcing judgments under U.S. securities laws.
This list is not exhaustive of the factors that may affect any of the Company’s forward-looking statements. Forward-looking statements are statements about the future and are inherently uncertain, and actual achievements of the Company or other future events or conditions may differ materially from those reflected in the forward-looking statements due to a variety of risks, uncertainties and other factors, including, without limitation, those referred to in the Company’s Annual Information Form for the year ended March 31, 2018 under the heading “Risk Factors”. Although the Company has attempted to identify important factors that could cause actual results to differ materially, there may be other factors that cause results not to be as anticipated, estimated, described or intended. Accordingly, readers should not place undue reliance on forward-looking statements.
The Company’s forward-looking statements are based on the assumptions, beliefs, expectations and opinions of management as of the date of this news release, and other than as required by applicable securities laws, the Company does not assume any obligation to update forward-looking statements if circumstances or management’s assumptions, beliefs, expectations or opinions should change, or changes in any other events affecting such statements. For the reasons set forth above, investors should not place undue reliance on forward-looking statements.