VANCOUVER, British Columbia – November 7, 2019 – Silvercorp Metals Inc. (“Silvercorp” or the “Company”) (TSX/NYSE American: SVM) reported its financial and operating results for the second quarter ended September 30, 2019 (“Q2 Fiscal 2020”). All amounts are expressed in US Dollars.
Q2 FISCAL YEAR 2020 HIGHLIGHTS
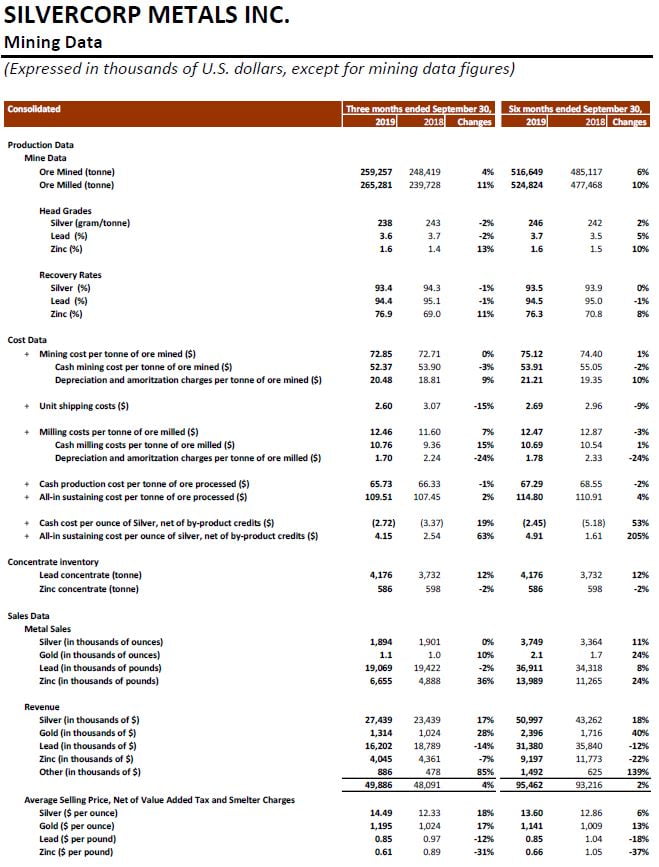
- Ore milled up 11% compared to the prior year quarter;
- Produced and sold approximately 1.9 million ounces of silver, 1,100 ounces of gold, 19.1 million pounds of lead, and 6.7 million pounds of zinc, compared to 1.9 million ounces of silver, 1,000 ounces of gold, 19.4 million pounds of lead, and 4.9 million pounds of zinc in the prior year quarter;
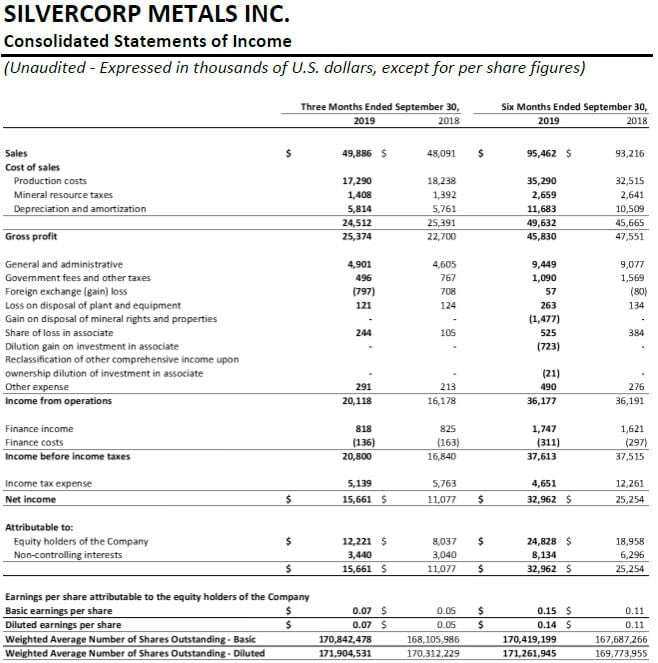
- Revenue up 4% to $49.9 million compared to the prior year quarter;
- Net income attributable to equity shareholders of $12.2 million, or $0.07 per share, up 52% compared to $8.0 million, or $0.05 per share in the prior year quarter;
- Cash production cost per tonne of ore processed1 of $65.73, down 1%, compared to $66.33 in the prior year quarter;
- Cash cost per ounce of silver1, net of by-product credits, of negative $2.72, up 20% compared to negative $3.37 in the prior year quarter;
- All-in sustaining cost per ounce of silver1, net of by-product credits, of $4.15, up 63% compared to $2.54 in the prior year quarter;
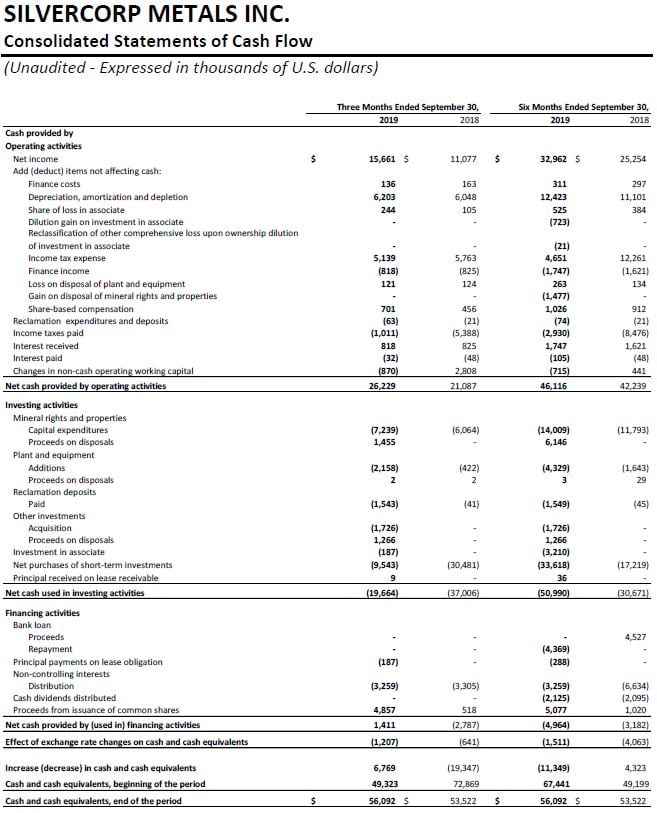
- Cash flow from operations of $26.2 million, up 24% compared to $21.1 million in the prior year quarter;
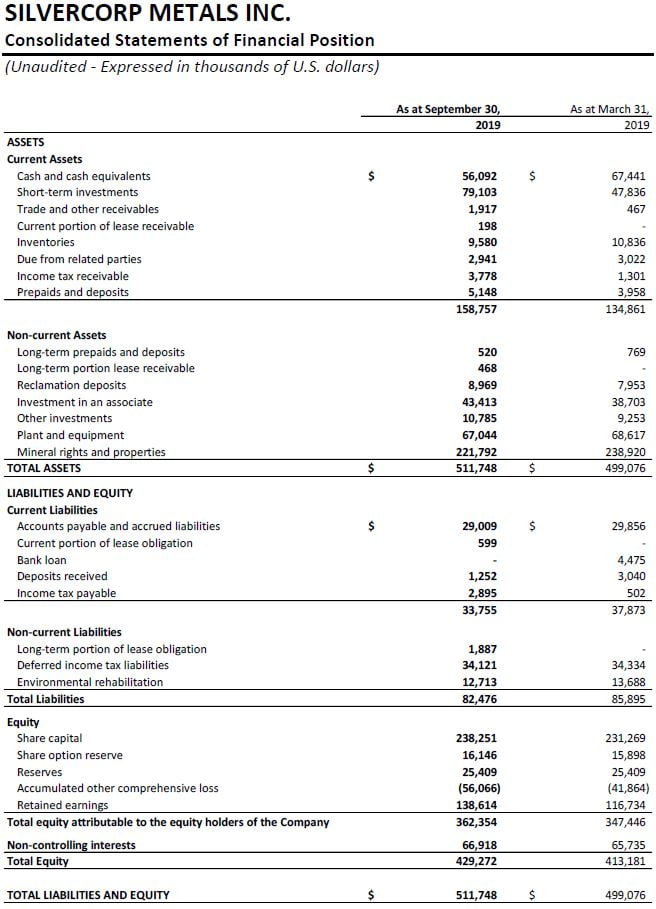
- Strong balance sheet with $135.2 million in cash and cash equivalents and short-term investments, an increase of $19.9 million or 17%, compared to $115.3 million as at March 31, 2019; and,
- Ended the quarter with inventories of 4,176 tonnes of silver-lead concentrate and 586 tonnes of zinc concentrate, up 28% and 59%, respectively, compared to 3,248 tonnes of silver-lead concentrate and 586 tonnes of zinc concentrate as at March 31, 2019.
FINANCIALS
Net income attributable to equity shareholders of the Company in Q2 Fiscal 2020 was $12.2 million, or $0.07 per share, an increase of $4.2 million, compared to $8.0 million, or $0.05 per share in the three months ended September 30, 2018 (“Q2 Fiscal 2019”).
Compared to Q2 Fiscal 2019, the Company’s financial results in Q2 Fiscal 2020 were mainly impacted by i) increases of 18% and 17% in the average realized selling prices for silver and gold; ii) increases of 10% and 36% in gold and zinc sold; offset by iii) decreases of 12% and 31% in the average realized selling prices for lead and zinc, and iv) a decrease of 2% in lead sold.
Sales in Q2 Fiscal 2020 were $49.9 million, up 4% or $1.8 million, compared to $48.1 million in Q2 Fiscal 2019. Silver, gold, and base metals sales represented $27.4 million, $1.3 million, and $21.1 million, respectively, compared to silver, gold and base metals sales of $23.4 million, $1.0 million, and $23.6 million, respectively, in Q2 Fiscal 2019.
Cost of sales in Q2 Fiscal 2020 was $24.5 million, a decrease of $0.9 million or 4%, compared to $25.4 million in Q2 Fiscal 2019. The cost of sales included $17.3 million (Q2 Fiscal 2019 – $18.2 million) cash production costs, $1.4 million mineral resources tax (Q2 Fiscal 2019 – $1.4 million), and $5.8 million (Q2 Fiscal 2019 – $5.8 million) depreciation and amortization charges. The decrease in cash production costs expensed was mainly due to a decrease of 1% in cash production costs per tonne of ore processed and less silver and lead sold.
Gross profit margin in Q2 Fiscal 2020 was 51%, compared to 47% in Q2 Fiscal 2019. Ying Mining District’s gross profit margin was 53% compared to 50% in Q2 Fiscal 2019. GC Mine’s gross profit margin was 37% compared to 29% in Q2 Fiscal 2019.
General and administrative expenses in Q2 Fiscal 2020 were $4.9 million, an increase of $0.3 million, compared to $4.6 million in Q2 Fiscal 2019. The increase was mainly due to higher labour costs resulting from an increase in employees’ pay-rates and non-cash share-based compensation expenses.
Share of loss in an associate in Q2 Fiscal 2020 was $0.2 million, compared to $0.1 million in Q2 Fiscal 2019. The loss represents the Company’s equity pickup in New Pacific Metals Corp.(“NUAG”).
Income tax expenses in Q2 Fiscal 2020 were $5.1 million compared to $5.8 million in Q2 Fiscal 2019. The income tax expense recorded in Q2 Fiscal 2020 included current income tax expense of $1.0 million (Q2 Fiscal 2019 – $5.1 million) and deferred income tax expense of $4.1 million (Q2 Fiscal 2019 – $0.7 million).
Cash flow provided by operating activities in Q2 Fiscal 2020 was $26.2 million, an increase of $5.1 million, compared to $21.1 million in Q2 Fiscal 2019.
For the six months ended September 30, 2019, net income attributable to equity shareholders of the Company was $24.8 million or $0.14 per share, an increase of $5.8 million, compared to $19.0 million or $0.11 per share in the same prior year period; sales were $95.5 million, up 2% from $93.2 million in the same prior year period; share of loss in NUAG was $0.5 million, compared to $0.4 million in the same prior year period; and cash flow from operating activities was $46.1 million, up 9% from $42.2 million in the same prior year period.
The Company ended the period with $135.2 million in cash and short-term investments, an increase of $19.9 million or 17%, compared to $115.3 million as at March 31, 2019.
Working capital as at September 30, 2019 was $125.0 million, an increase of $28.0 million or 29%, compared to $97.0 million as at March 31, 2019.
OPERATIONS AND DEVELOPMENT
1. Q2 Fiscal 2020 vs. Q2 Fiscal 2019
In Q2 Fiscal 2020, on a consolidated basis, the Company mined 259,257 tonnes of ore, an increase of 4% or 10,838 tonnes, compared to 248,419 tonnes in Q2 Fiscal 2019. Ore mined at the GC Mine increased by 23% or 15,415 tonnes, while the ore mined at the Ying Mining District decreased by 3% or 4,577 tonnes. Ore milled was 265,281 tonnes, up 11% compared to 239,728 tonnes in Q2 Fiscal 2019.
In Q2 Fiscal 2020, the Company sold approximately 1.9 million ounces of silver, 1,100 ounces of gold, 19.1 million pounds of lead, and 6.7 million pounds of zinc, compared to 1.9 million ounces of silver, 1,000 ounces of gold, 19.4 million pounds of lead, and 4.9 million pounds of zinc in Q2 Fiscal 2019. As at September 30, 2019, the Company had inventories of 4,176 tonnes of silver-lead concentrate and 586 tonnes of zinc concentrate, up 28% and 59%, respectively, compared to 3,248 tonnes of silver-lead concentrate and 368 tonnes of zinc concentrate as at March 31, 2019.
In Q2 Fiscal 2020, the consolidated total mining costs and cash mining costs were $72.85 and $52.37 per tonne, compared to $72.71 and $53.90 per tonne, respectively, in Q2 Fiscal 2019. The consolidated total milling costs and cash milling costs in Q2 Fiscal 2020 were $12.46 and $10.76 per tonne, compared to $11.60 and $9.36 per tonne, respectively, in Q2 Fiscal 2019. The increase in the cash milling cost was mainly due to an increase of $0.3 million in material costs resulting from the timing difference of maintenance and prevention work performed at the mills.
The consolidated cash production cost per tonne of ore processed in Q2 Fiscal 2020 were $65.73, down 1% compared to $66.33 in Q2 Fiscal 2019, and below the Company’s Fiscal 2020 annual guidance of $71.80. The consolidated all-in sustaining production cost per tonne of ore processed was $109.51, an increase of 2% compared to $107.51 in Q2 Fiscal 2019, but below the Company’s Fiscal 2020 annual guidance of $125.50. The increase was primarily due to an increase of $1.7 million in sustaining capital expenditures.
In Q2 Fiscal 2020, the consolidated cash cost per ounce of silver, net of by-product credits, was negative $2.72, compared to negative $3.37 in the prior year quarter. The increase was mainly due to a decrease of $1.11 in by-product credits per ounce of silver mainly resulting from the decrease in the realized selling prices for lead and zinc. Sales from lead and zinc in the current quarter amounted to $20.2 million, a decrease of $2.9 million, compared to $23.2 million in the prior year quarter. In Q2 Fiscal 2020, the consolidated all-in sustaining costs per ounce of silver, net of by-product credits, was $4.15 compared to $2.54 in Q2 Fiscal 2019. The increase was mainly due to the decrease in by-product credits and the increase in sustaining capital expenditures as discussed above.
In Q2 Fiscal 2020, on a consolidated basis, approximately 32,948 metres or $1.1 million worth of diamond drilling (Q2 Fiscal 2019 – 30,027 metres or $0.8 million) and 11,656 metres or $3.1 million worth of preparation tunnelling (Q2 Fiscal 2019 – 10,619 metres or $3.1 million) were completed and expensed as mining preparation costs. In addition, approximately 20,107 metres or $7.1 million worth of horizontal tunnels, raises, ramps and declines (Q2 Fiscal 2019 – 18,875 metres or $6.2 million) were completed and capitalized.
2. Six months ended September 30, 2019 vs. six months ended September 30, 2018
For the six months ended September 30, 2019, on a consolidated basis, the Company mined 516,649 tonnes of ore, an increase of 6% or 31,532 tonnes, compared to 485,117 tonnes mined in the same prior year period. Ore milled was 524,824 tonnes, up 10% compared to 477,468 tonnes in the same prior year period.
The Company sold approximately 3.7 million ounces of silver, 2,100 ounces of gold, 36.9 million pounds of lead, and 14.0 million pounds of zinc, increases of 11%, 24%, 8%, and 24%, respectively, compared to 3.4 million ounces of silver, 1,700 ounces of gold, 34.3 million pounds of lead, and 11.3 million pounds of zinc sold in the same prior year period.
For the six months ended September 30, 2019, the consolidated total mining costs and cash mining costs were $75.12 and $53.91 per tonne, respectively, compared to $74.40 and $55.05 per tonne in the same prior year period. The consolidated total milling costs and cash milling costs were $12.47 and $10.69, respectively, compared to $12.87 and $10.54 per tonne in the same prior year period.
Correspondingly, the consolidated cash production costs per tonne of ore processed for the six months ended September 30, 2019 were $67.29, down 2% compared to $68.55 in the same prior year period. The all-in sustaining production costs per tonne of ore processed were $114.89, up 4% compared to $110.91 in the same prior year period mainly due to an increase of $4.7 million in sustaining capital expenditures. However, both the cash production costs and all-in sustaining production costs per tonne were lower than the Company’s Fiscal 2020 annual guidance
For the six months ended September 30, 2019, the consolidated cash cost per ounce of silver, net of by-product credits, was negative $2.45, compared to negative $5.18 in the same prior year period. The increase was mainly due to a decrease of $2.99 in by-product credits per ounce of silver mainly resulting from decreases in realized selling prices for lead and zinc. Sales from lead and zinc for the six months ended September 30, 2019 amounted to $40.6 million, a decrease of $7.0 million, compared to $47.6 million in the same period year period. The consolidated all-in sustaining costs per ounce of silver, net of by-product credits, was $4.91 compared to $1.61 in the same prior year period. The increase was mainly due to the decrease in by-product credits and the increase in sustaining capital expenditures.
For the six months ended September 30, 2019, on a consolidated basis, approximately 64,566 metres or $2.0 million worth of diamond drilling (same prior year period – 64,295 metres or $1.8 million) and 24,312 metres or $6.2 million worth of preparation tunnelling (same prior year period – 21,401 metres or $6.3 million) were completed and expensed as mining preparation costs. In addition, approximately 41,499 metres or $14.5 million worth of horizontal tunnels, raises, ramps and declines (same prior year period – 36,341 metres or $13.2 million) were completed and capitalized.
1. Q2 Fiscal 2020 vs. Q2 Fiscal 2019
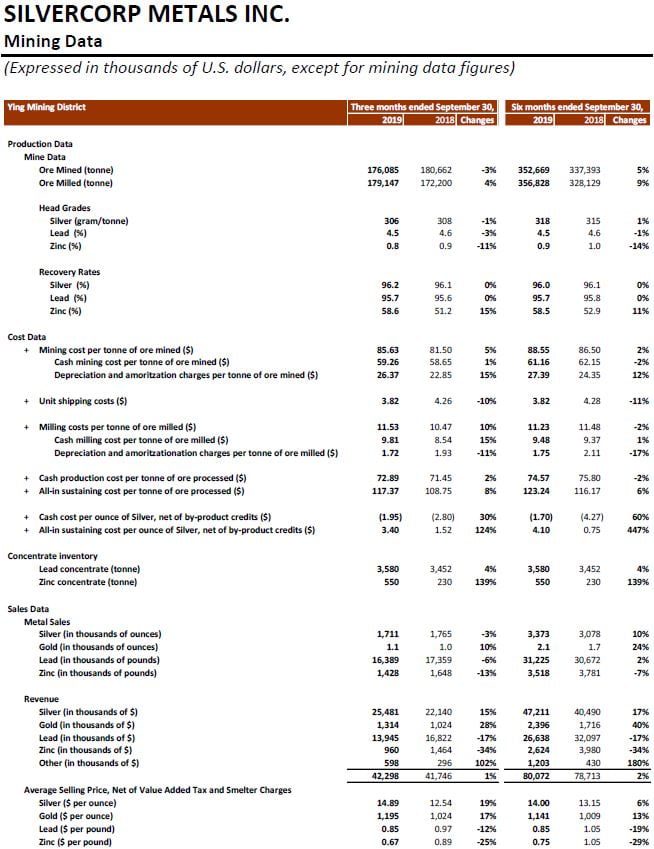
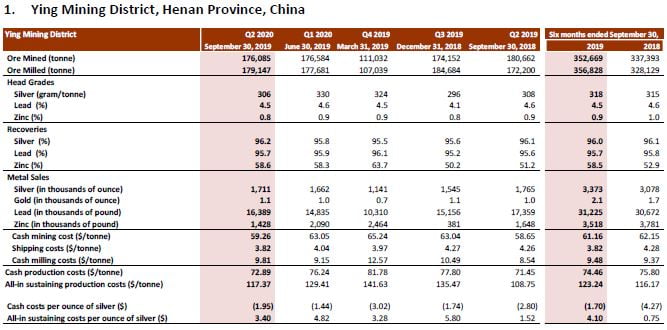
In Q2 Fiscal 2020, the total ore mined at the Ying Mining District was 176,085 tonnes, down by 3% or 4,577 tonnes, compared to 180,662 tonnes mined in Q2 Fiscal 2019. Ore milled was 179,147 tonnes, up by 4% or 6,947 tonnes, compared to 172,200 tonnes in Q2 Fiscal 2019.
Head grades of ore milled at the Ying Mining District in Q2 Fiscal 2020 were 306 grams per tonne (“g/t”) for silver, 4.5% for lead, and 0.8% for zinc, compared to 308 g/t for silver, 4.6% for lead and 0.9% for zinc in Q2 Fiscal 2019. The Company continues to achieve good dilution control using its “Enterprise Blog” to assist and manage daily operations.
In Q2 Fiscal 2020, the Ying Mining District sold approximately 1.7 million ounces of silver, 16.4 million pounds of lead, and 1.4 million pounds of zinc, compared to 1.8 million ounces of silver, 17.4 million pounds of lead, and 1.6 million pounds of zinc in Q2 Fiscal 2019. As at September 30, 2019, the Ying Mining District had inventories of 3,580 tonnes of silver-lead concentrate and 550 tonnes zinc concentrate, compared to 3,150 tonnes of silver-lead concentrate and 250 tonnes of zinc concentrate as at March 31, 2019.
Total and cash mining costs per tonne at the Ying Mining District in Q2 Fiscal 2020 were $85.63 and $59.26 per tonne, respectively, compared to $81.50 and $58.65 per tonne in Q2 Fiscal 2019. The increase was due mainly to an overall 3% increase in the mining contractors’ rate.
Total and cash milling costs per tonne at the Ying Mining District in Q2 Fiscal 2020 were $11.53 and $9.81, respectively, compared to $10.47 and $8.54 in Q2 Fiscal 2019. The increase in per tonne cash milling costs was mainly due to an increase of $0.2 million in material costs rising from the timing difference of maintenance and prevention work performed at the mill.
Correspondingly, the cash production cost per tonne of ore processed was $72.89, up 2% compared to $71.45 in the prior year quarter, but below the Fiscal 2020 annual guidance of $78.20. The all-in sustaining cash production cost per tonne of ore processed were $117.37, up 8% compared to $108.75 in the prior year quarter. The increase was mainly due to an increase of $1.3 million in sustaining capital expenditures. The all-in sustaining cash production costs per tonne at the Ying Mining District were also below the Fiscal 2020 annual guidance of $130.20.
Cash cost per ounce of silver, net of by-product credits, in Q2 Fiscal 2020 at the Ying Mining District, was negative $1.95 compared to negative $2.80 in Q2 Fiscal 2019. The increase was mainly due to a decrease of $1.28 in by-product credits per ounce of silver resulting from the decrease of lead and zinc realized selling prices. Sales from lead and zinc at the Ying Mining District in Q2 Fiscal 2020 were $14.9 million, a decrease of $3.4million, compared to $18.3 million in Q2 Fiscal 2019. All-in sustaining cost per ounce of silver, net of by-product credits, was $3.40 compared to $1.52 in the prior year quarter. The increase was mainly due to the decrease in by-product credits and the increase in sustaining capital expenditures.
In Q2 Fiscal 2020, approximately 27,007 metres or $0.8 million worth of underground diamond drilling (Q2 Fiscal 2019 – 22,672 metres or $0.5 million) and 5,554 metres or $1.6 million worth of preparation tunnelling (Q2 Fiscal 2019 – 5,376 metres or $1.7 million) were completed and expensed as mining preparation costs at the Ying Mining District. In addition, approximately 19,661 metres or $6.7 million worth of horizontal tunnels, raises, ramps and declines (Q2 Fiscal 2019 – 18,634 metres or $6.0 million) were completed and capitalized.
2. Six months ended September 30, 2019 vs. six months ended September 30, 2018
For the six months ended September 30, 2019, a total of 352,669 tonnes of ore were mined at the Ying Mining District, an increase of 5% or 15,276 tonnes compared to 337,393 tonnes in the same prior year period. Ore milled was 356,828 tonnes, up by 9% or 28,669 tonnes compared to 328,129 tonnes in the same prior year period. Average head grades of ore processed were 318 g/t for silver, 4.5% for lead, and 0.9% for zinc compared to 315 g/t for silver, 4.6% for lead, and 1.0% for zinc, in the same prior year period.
During the same time period, the Ying Mining District sold approximately 3.4 million ounces of silver, 2,100 ounces of gold, 31.2 million pounds of lead, and 3.5 million pounds of zinc, compared to 3.1 million ounces of silver, 1,700 ounces of gold, 30.7 million pounds of lead, and 3.8 million pounds of zinc in the same prior year period.
For the six months ended September 30, 2019, the cash mining costs at the Ying Mining District were $61.16 per tonne, down 2% compared to $62.15 in the prior year period while the cash milling costs were $9.48 per tonne, a slight increase of 1% compared to $9.37 in the prior year period. Correspondingly, the cash production costs per tonne of ore processed were $74.57, down 2% compared to $75.80 in the prior year period. The all-in sustaining cash production costs per tonne of ore processed were $123.24, up 6%, compared to $116.17. The increase was mainly due to an increase of $3.8 million in sustaining capital expenditures.
Cash cost per ounce of silver and all-in sustaining costs per ounce of silver, net of by‐product credits, at the Ying Mining District, for the six months ended September 30, 2019, were negative $1.70 and $4.10 respectively, compared to negative $4.27 and $0.75 in the same prior year period. The increase was mainly due to the decrease in by-product credits per ounce of silver and the increase in sustaining capital expenditures. Sales from lead and zinc at the Ying Mining District for the six months ended September 30, 2019 were $29.3 million, a decrease of $6.8 million, compared to $36.1 million in the same prior year period.
For the six months ended September 30, 2019, approximately 50,655 metres or $1.4 million worth of underground diamond drilling (same prior year period – 49,521 metres or $1.1 million) and 11,949 metres or $3.3 million worth of preparation tunnelling (same prior year period – 10,917 metres or $3.3 million) were completed and expensed as mining preparation costs at the Ying Mining District. In addition, approximately 40,556 metres or $13.8 million worth of horizontal tunnels, raises, and declines (same prior year period – 35,562 metres or $12.5 million) were completed and capitalized.

1. Q2 Fiscal 2020 vs. Q2 Fiscal 2019
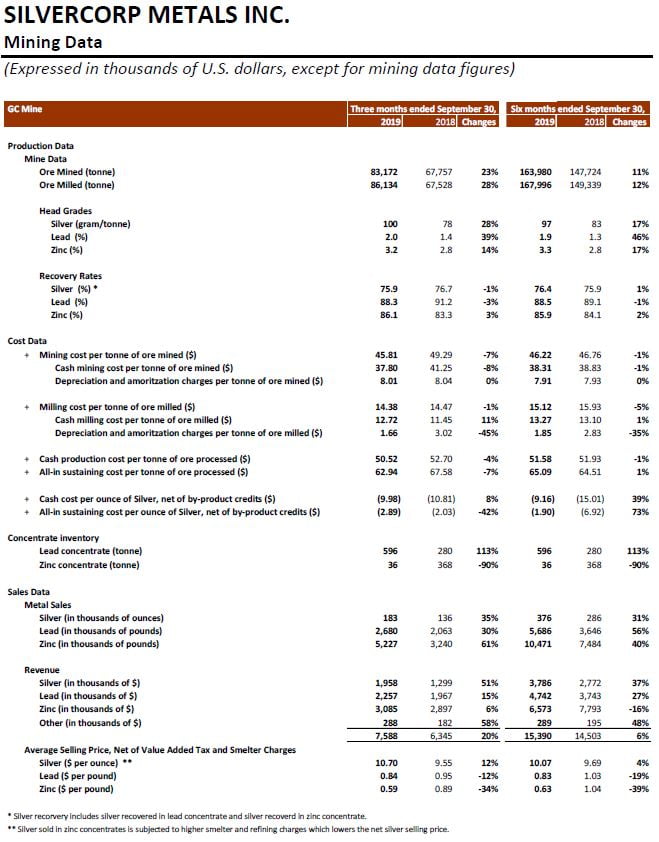
In Q2 Fiscal 2020, the total ore mined at the GC Mine was 83,172 tonnes, an increase of 23% or 15,415 tonnes, compared to 67,757 tonnes in Q2 Fiscal 2019, while ore milled was 86,134 tonnes, an increase of 28% or 18,606 tonnes compared to 67,528 tonnes in Q2 Fiscal 2019. Average head grades of ore processed at the GC Mine were 100 g/t for silver, 2.0% for lead, and 3.2% for zinc compared to 78 g/t for silver, 1.4% for lead, and 2.8% for zinc in Q2 Fiscal 2019.
In Q2 Fiscal 2020, the GC Mine sold 183,000 ounces of silver, 2.7 million pounds of lead, and 5.2 million pounds of zinc, compared to 136,000 ounces of silver, 2.1 million pounds of lead, and 3.2 million pounds of zinc in Q2 Fiscal 2019.
Total and cash mining costs per tonne at the GC Mine in Q2 Fiscal 2020 were $45.81 and $37.80 per tonne, respectively, a decrease of 7% and 8%, compared to $49.29 and $41.25 per tonne in Q2 Fiscal 2019. The decrease was mainly due to higher production output resulting in lower per tonne fixed costs allocation. Total and cash milling costs per tonne at the GC Mine in Q2 Fiscal 2020 were $14.38 and $12.72, respectively, compared to $14.47 and $11.45 in Q2 Fiscal 2019.
Correspondingly, cash production costs per tonne of ore processed were $50.52, down 4% compared to $52.70 in Q2 Fiscal 2019, and all-in sustaining costs per tonne of ore processed were $62.94, down 7% compared to $67.58 in Q2 Fiscal 2019.
Cash costs per ounce of silver, net of by-product credits, at the GC Mine, was negative $9.98 compared to negative $10.81 in Q2 Fiscal 2019. The increase was mainly due to the decrease in by-product credits per ounce of silver resulting from more silver sold and the decrease in lead and zinc realized selling prices. All-in sustaining costs per ounce of silver, net of by-product credits, in Q2 Fiscal 2020 at the GC Mine was negative $2.89 compared to negative $2.03 in Q2 Fiscal 2019.
In Q2 Fiscal 2020, approximately 5,941 metres or $0.3 million worth of underground diamond drilling (Q2 Fiscal 2019 – 7,355 metres or $0.3 million) and 6,102 metres or $1.5 million worth of tunnelling (Q2 Fiscal 2019 – 5,243 metres or $1.4 million) were completed and expensed as mining preparation costs at the GC Mine. In addition, approximately 446 metres or $0.4 million of horizontal tunnels, raises and declines (Q2 Fiscal 2019 – 241 metres or $0.2 million) were completed and capitalized.
2. Six months ended September 30, 2019 vs. six months ended September 30, 2018
For the six months ended September 30, 2019, a total of 163,980 tonnes of ore were mined and 167,996 tonnes were milled at the GC Mine, an increase of 11% and 12%, respectively, compared to 147,724 tonnes mined and 149,339 tonnes milled in the same prior year period. Average head grades of ore milled were 97 g/t for silver, 1.9% for lead, and 3.3% for zinc compared to 83 g/t for silver, 1.3% for lead, and 2.8% for zinc, in the same prior year period.
During the same time period, the GC Mine sold approximately 376,000 ounces of silver, 5.7 million pounds of lead, and 10.5 million pounds of zinc, compared to 286,000 ounces of silver, 3.6 million pounds of lead, and 7.5 million pounds of zinc in the same prior year period.
For the six months ended September 30, 2019, the cash mining cost at the GC Mine was $38.31 per tonne, a slight decrease of 1% compared to $38.83 per tonne in the same prior year period. The cash milling cost was $13.27 per tonne, a slight increase of 1% compared to $13.10 in the same prior year period. Correspondingly, the cash production costs per tonne of ore processed at the GC Mine were $51.58, a slight decrease compared to $51.93 in the same prior year period. The all-in sustaining cash production cost per tonne of ore processed was $65.09 compared to $64.51 in the same prior year period.
Cash costs per ounce of silver and all-in sustaining costs per ounce of silver, net of by‐product credits, at the GC Mine, for the six months ended September 30, 2019, were negative $9.16 and negative $1.90 respectively, compared to negative $15.01 and negative $6.92 in the same prior year period.
For the six months ended September 30, 2019, approximately 13,911 metres or $0.6 million worth of underground diamond drilling (same prior year period – 14,774 metres or $0.7 million) and 12,363 m or $2.9 million of tunnelling (same prior year period – 10,484 metres or $3.0 million) were completed and expensed as mining preparation costs at the GC Mine. In addition, approximately 943 metres or $0.7 million of horizontal tunnels, raise, and declines (same prior year period – 779 metres or $0.7 million) were completed and capitalized.
OUTLOOK
The Company expects its consolidated production in Fiscal 2020 will exceed its annual guidance and that production costs will be within the budget. Due to soft demand for lead battery arising from weak automobile market and the winter season environmental control measures in China, smelters are reducing their silver-lead concentrates purchase and increasing their smelter charges from last quarter’s RMB 2,200 per tonne lead metal to RMB 2,700 per tonne lead metal currently. Accordingly, the Company plans to build up its silver-lead concentrate inventories over the next two quarters for better price.
Mr. Guoliang Ma, P.Geo., Manager of Exploration and Resources of the Company, is the Qualified Person for Silvercorp under NI 43-101 and has reviewed and given consent to the technical information contained in this news release.
This earnings release should be read in conjunction with the Company’s Management Discussion & Analysis, Financial Statements and Notes to Financial Statements for the corresponding period, which have been posted on SEDAR under the Company’s profile at www.sedar.com and are also available on the Company’s website at www.silvercorp.ca.
About Silvercorp
Silvercorp is a profitable Canadian mining company producing silver, lead and zinc metals in concentrates from mines in China. The Company’s goal is to continuously create healthy returns to shareholders through efficient management, organic growth and the acquisition of profitable projects. Silvercorp balances profitability, social and environmental relationships, employees’ wellbeing, and sustainable development. For more information, please visit our website at www.silvercorp.ca.
For further information
Silvercorp Metals Inc.
Lon Shaver
Vice President
Phone: (604) 669-9397
Toll Free 1(888) 224-1881
Email: investor@silvercorp.ca
Website: www.silvercorp.ca
CAUTIONARY DISCLAIMER – FORWARD-LOOKING STATEMENTS
Certain of the statements and information in this news release constitute “forward-looking statements” within the meaning of the United States Private Securities Litigation Reform Act of 1995 and “forward-looking information” within the meaning of applicable Canadian provincial securities laws (collectively, “forward-looking statements”). Any statements or information that express or involve discussions with respect to predictions, expectations, beliefs, plans, projections, objectives, assumptions or future events or performance (often, but not always, using words or phrases such as “expects”, “is expected”, “anticipates”, “believes”, “plans”, “projects”, “estimates”, “assumes”, “intends”, “strategies”, “targets”, “goals”, “forecasts”, “objectives”, “budgets”, “schedules”, “potential” or variations thereof or stating that certain actions, events or results “may”, “could”, “would”, “might” or “will” be taken, occur or be achieved, or the negative of any of these terms and similar expressions) are not statements of historical fact and may be forward-looking statements. Forward-looking statements relate to, among other things: the price of silver and other metals; the accuracy of mineral resource and mineral reserve estimates at the Company’s material properties; the sufficiency of the Company’s capital to finance the Company’s operations; estimates of the Company’s revenues and capital expenditures; estimated production from the Company’s mines in the Ying Mining District and the GC Mine; timing of receipt of permits and regulatory approvals; availability of funds from production to finance the Company’s operations; and access to and availability of funding for future construction, use of proceeds from any financing and development of the Company’s properties.
Forward-looking statements are subject to a variety of known and unknown risks, uncertainties and other factors that could cause actual events or results to differ from those reflected in the forward-looking statements, including, without limitation, risks relating to: fluctuating commodity prices; calculation of resources, reserves and mineralization and precious and base metal recovery; interpretations and assumptions of mineral resource and mineral reserve estimates; exploration and development programs; feasibility and engineering reports; permits and licences; title to properties; property interests; joint venture partners; acquisition of commercially mineable mineral rights; financing; recent market events and conditions; economic factors affecting the Company; timing, estimated amount, capital and operating expenditures and economic returns of future production; integration of future acquisitions into the Company’s existing operations; competition; operations and political conditions; regulatory environment in China and Canada; environmental risks; foreign exchange rate fluctuations; insurance; risks and hazards of mining operations; key personnel; conflicts of interest; dependence on management; internal control over financial reporting; and bringing actions and enforcing judgments under U.S. securities laws.
This list is not exhaustive of the factors that may affect any of the Company’s forward-looking statements. Forward-looking statements are statements about the future and are inherently uncertain, and actual achievements of the Company or other future events or conditions may differ materially from those reflected in the forward-looking statements due to a variety of risks, uncertainties and other factors, including, without limitation, those referred to in the Company’s Annual Information Form under the heading “Risk Factors”. Although the Company has attempted to identify important factors that could cause actual results to differ materially, there may be other factors that cause results not to be as anticipated, estimated, described or intended. Accordingly, readers should not place undue reliance on forward-looking statements.
The Company’s forward-looking statements are based on the assumptions, beliefs, expectations and opinions of management as of the date of this news release, and other than as required by applicable securities laws, the Company does not assume any obligation to update forward-looking statements if circumstances or management’s assumptions, beliefs, expectations or opinions should change, or changes in any other events affecting such statements. For the reasons set forth above, investors should not place undue reliance on forward-looking statements.