VANCOUVER, British Columbia – November 3, 2016 – Silvercorp Metals Inc. (“Silvercorp” or the “Company”) (TSX: SVM) reported its financial and operating results for the second quarter ended September 30, 2016 (“Q2 Fiscal 2017”). All amounts are expressed in US Dollars.
SECOND QUARTER HIGHLIGHTS
- Net income attributable to equity shareholders of $12.4 million, or $0.07 per share, up 454% compared with net earnings attributable to equity shareholders of $2.2 million or $0.01 per share in the prior year period;
- Silver, lead and zinc sales up 44%, 51%, and 27%, respectively, from the prior year period, to approximately 1.8 million ounces silver, 19.9 million pounds lead, and 5.9 million pounds zinc;
- Sales of $46.3 million, up 70% from the prior year period;
- A 16%, 21%, and 22% increase in the head grades of silver, lead, and zinc;
- Gross margin improved to 58% from 32% in the prior year period;
- Cash flows from operations of $27.0 million, an increase of $22.4 million compared to $4.6 million in the prior year period;
- Cash production cost per tonne of $55.84 compared with $70.49 in the prior year period;
- Cash cost per ounce of silver1, net of by-product credits, of negative $3.05, compared to $1.52 in the prior year period;
- All-in sustaining cost per ounce of silver1, net of by-product credits, of $3.16, compared to $12.40 in the prior year quarter; and
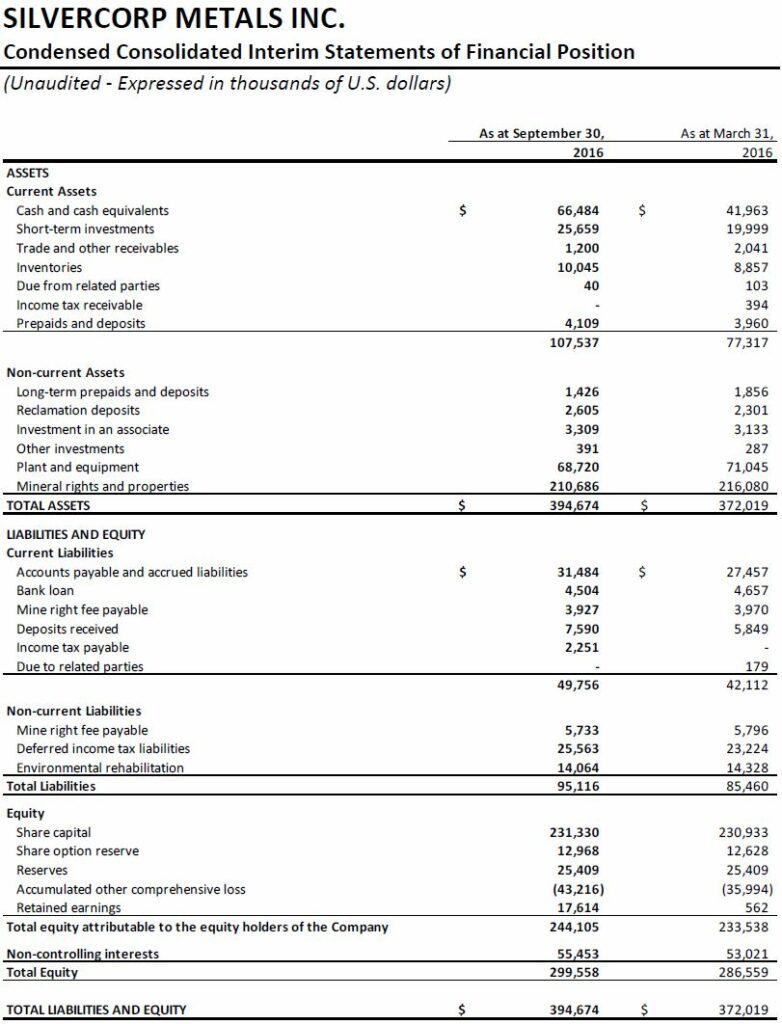
- Ended the period with $92.1 million in cash and short term investments, an increase of $30.1 million compared to $62.0 million as at March 31, 2016.
FINANCIALS
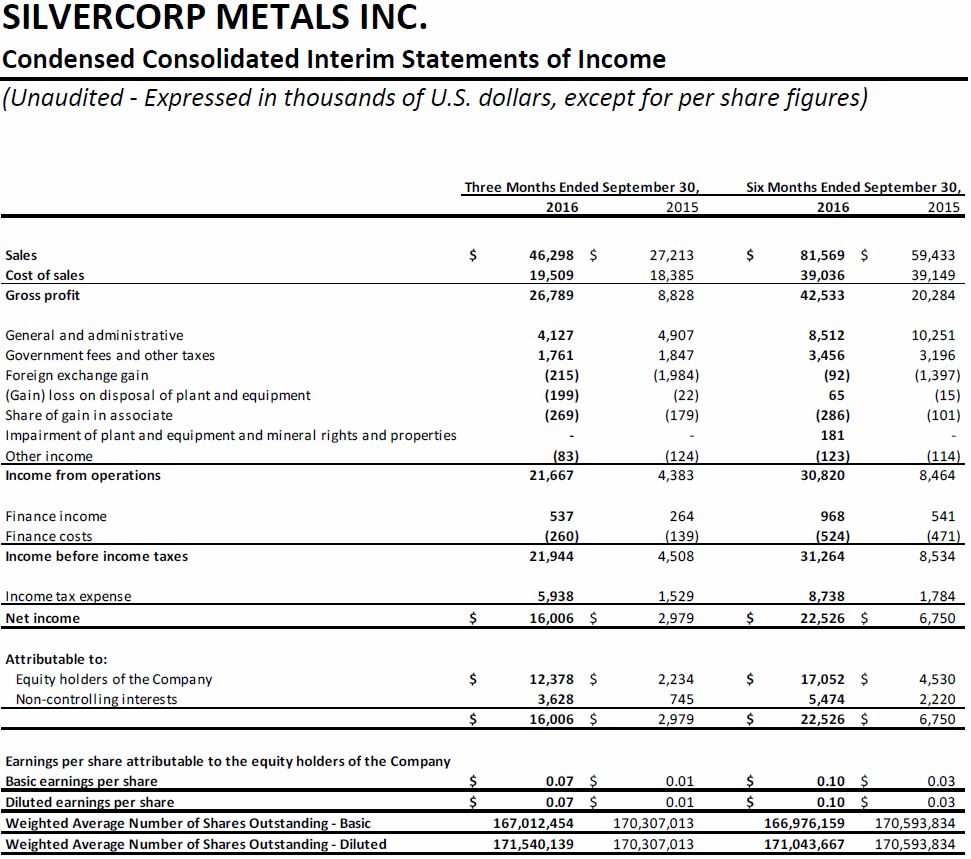
Net income attributable to the shareholders of the Company in Q2 Fiscal 2017 was $12.4 million, or $0.07 per share, up 454% compared to $2.2 million, or $0.01 per share in Q2 Fiscal 2016.
In the current quarter, the Company’s financial results were mainly impacted by the following: i) improved head grades yielded higher silver, lead, zinc sales, up 44%, 51% and 27%, respectively; ii) a 14% decrease in total production costs per tonne of ore processed; and iii) the increase of metals prices, as the realized selling price for silver, lead, and zinc increased by 27%, 3% and 22%, respectively, compared to the same prior year quarter.
Sales in Q2 Fiscal 2017 were $46.3 million, up 70% compared to $27.2 million in Q2 Fiscal 2016. Silver and gold sales represented $27.0 million and $1.1 million, respectively, while base metals represented $18.2 million of total sales in this quarter compared to silver, gold and base metals of $14.7 million, $0.5 million, and $12.0 million, respectively, in Q2 Fiscal 2016.
Cost of sales in Q2 Fiscal 2017 was $19.5 million compared to $18.4 million in Q2 Fiscal 2016. The cost of sales included $13.8 million (Q2 Fiscal 2016 – $14.4 million) cash costs and $5.7 million (Q2 Fiscal 2016 – $4.0 million) depreciation, amortization and depletion charges. The decrease of cash cost of sales was mainly due to a 21% decrease in cash production costs per tonne of ore processed offset by an increase of metals sold. The total per tonne ore production cost was $79.61 in Q2 Fiscal 2017, a decrease of 14%, from $92.19 in Q2 Fiscal 2016.
Gross profit margin in Q2 Fiscal 2017 was 58% compared to 32% in Q2 Fiscal 2016. The improvement of gross profit margin was mainly due to: i) the improvement of head grades; ii) the decrease of per tonne ore production costs; and iii) the increase of metal prices. Ying Mining District’s gross profit margin was 61% compared to a 35% gross profit margin in the same prior year quarter, while GC Mine’s profit margin was 38% compared to a 18% gross profit margin in Q2 Fiscal 2016.
Cash flows provided by operating activities were $27.0 million or $0.16 per share in Q2 Fiscal 2017 compared to $4.6 million or $0.03 per share in Q2 Fiscal 2016. Before changes in non-cash operating working capital, cash flows provided by operating activities were $24.9 million, an increase of $15.7 million, compared to $9.2 million in Q2 Fiscal 2016 as a result of the improvement of operating earnings.
For the six months ended September 30, 2016, net income attributable to the shareholders of the Company was $17.1 million, or $0.10 per share, up 276% compared to $4.5 million, or $0.03 per share in the same period prior year; sales were $81.6 million, up 37% from $59.4 million in the same prior year period; and cash flows provided by operating activities were $47.2 million or $0.28 per share compared to $18.0 million or $0.11 per share in the same prior year period. Before changes in non-cash operating working capital, cash flows provided by operating activities for the six months ended September 30, 2016 were $40.5 million, an increase of $22.0 million or 119%, compared to $18.5 million in the same prior year period.
The Company ended the period with $92.1 million in cash and short term investments, an increase of $30.1 million or 48.5% compared to $62.0 million as at March 31, 2016.
OPERATIONS AND DEVELOPMENT
In Q2 Fiscal 2017, the Company sold approximately 1.8 million ounces of silver, 19.9 million pounds of lead, and 5.9 million pounds of zinc, up 44%, 51% and 27%, respectively, compared to 1.3 million ounces of silver, 13.2 million pounds of lead, and 4.6 million pounds of zinc in Q2 Fiscal 2016. The increase of metals sold on a consolidated basis, was mainly due to: i) a 16%, 21%, and 22% increase in the head grades of silver, lead and zinc,resulting largely from the ongoing dilution control measures and operation management improvements; ii) a 4% increase of ore milled; and iii) an increase in silver-lead concentrate inventories of 1,798 tonnes to 2,228 tonnes in Q2 Fiscal 2016 at the Ying Mining District. As at the end of Q2 Fiscal 2017, Ying Mining District held 3,880 tonnes of silver-lead concentrate inventories, and the estimated metals contained in silver-lead concentrate were approximately 0.4 million ounces of silver and 4.5 million pounds of lead.
For the six months ended September 30, 2016, on a consolidated basis, the Company sold approximately 3.5 million ounces of silver, 36.7 million pounds of lead, and 11.1 million pounds of zinc, up 31%, 33% and 23% compared to the same prior year period.
1. Ying Mining District, Henan Province, China
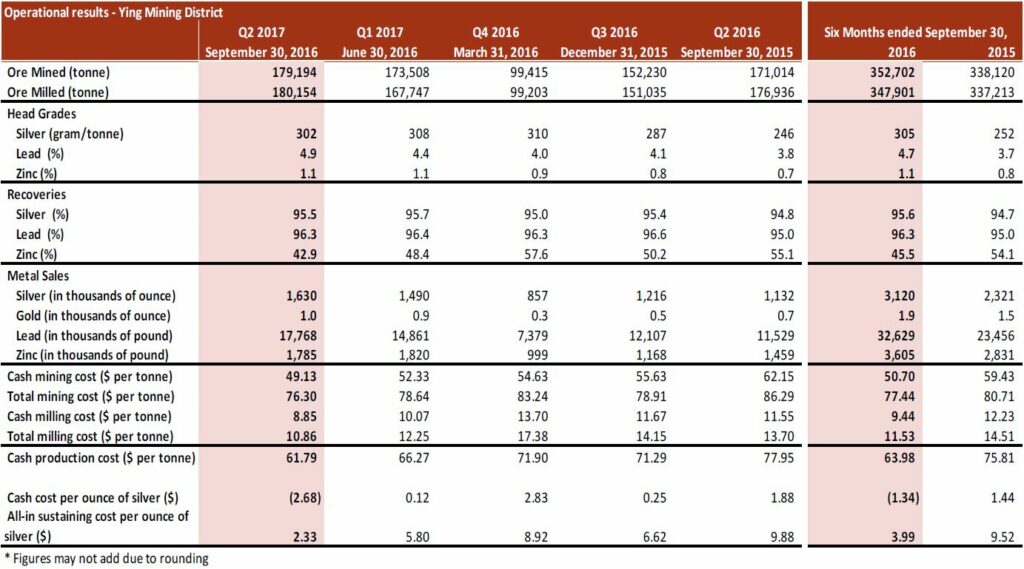
In Q2 Fiscal 2017, the total ore mined at the Ying Mining District was 179,194 tonnes, an increase of 5% compared to total ore production of 171,014 tonnes in Q2 Fiscal 2016. Silver, lead and zinc head grades improved by 23%, 28%, and 53%, respectively, to 302 grams per tonne (“g/t”) for silver, 4.9% for lead, and 1.1% for zinc from 246 g/t for silver, 3.8% for lead, and 0.7% for zinc, respectively, in Q2 Fiscal 2016, resulting largely from the ongoing dilution control and operation management improvements.
In Q2 Fiscal 2017, the Ying Mining District sold approximately 1.6 million ounces of silver, 1,000 ounces of gold, 17.8 million pounds of lead, and 1.8 million pounds of zinc, up 44%, 43%, 54%, and 22% respectively, compared to 1.1 million ounces of silver, 700 ounces of gold, 11.5 million pounds of lead, and 1.5 million pounds of zinc in Q2 Fiscal 2016. The increase in metals sold is mainly due to: i) the improved head grades achieved and higher ore production in the quarter, and ii) an increase in silver-lead concentrate inventories of 1,798 tonnes to 2,228 tonnes in the prior year quarter as the Company started intentionally to increase its concentrate inventories in reaction to the low metal prices in Q2 Fiscal 2016.
Total and cash mining costs per tonne in Q2 Fiscal 2017 were $76.30 and $49.13, respectively, compared to $86.29 and $62.15, respectively, in Q2 Fiscal 2016. The decrease in cash mining costs was mainly due to: i) a 22% decrease in contractor costs; ii) a 24% saving on raw material and maintenance costs; and offset by a 10% increase in labour costs.
Total ore milled at the Ying Mining District in Q2 Fiscal 2017 was 180,154 tonnes, an increase of 2% compared to 176,936 tonnes in Q2 Fiscal 2016. Cash milling costs in Q2 Fiscal 2017 were $8.85 compared to $11.55 in Q2 Fiscal 2016, and the decrease was mainly due to: i) a 7% reduction on utility costs; ii) a 6% decrease in raw material and maintenance costs; and iii) the exclusion of mineral resource tax from milling costs. Prior to June 30, 2016, mineral resource tax was levied at RMB¥13.0 per tonne of ore milled and included as part of milling costs. Effective July 1, 2016, mineral resource tax was changed to a levy based on a certain percentage of sales, and therefore such tax is excluded from milling costs but expensed directly and included in government fee and other taxes.
Cash production cost per tonne of ore processed at the Ying Mining District in Fiscal Q2 2017 was $61.79, a decrease of 21% compared to $77.95 in Q2 Fiscal 2016 as a result of the decrease in both per tonne cash mining and milling cost.
Cash cost per ounce of silver, net of by-product credits, at the Ying Mining District, was negative $2.68 in Q2 Fiscal 2017 compared to $1.88 in Q2 Fiscal 2016. The decrease was mainly due to: i) lower per tonne cash production costs as discussed above; and ii) a 60% increase in by-product credits, arising from more lead and zinc sold and higher metal prices.
All in sustaining costs per ounce of silver, net of by-product credits, at the Ying Mining District in Q2 2017 was $2.33 per ounce of silver compared to $9.88 in Q2 Fiscal 2016. The decrease was mainly due to: i) lower per tonne cash production cost and the increase in by-product credits as discussed above; and ii) a $0.7 million decrease in sustaining capital expenditures.
For the six months ended September 30, 2016, the total ore mined at the Ying Mining District was 352,702 tonnes, up 4% compared to 338,120 tonnes in the same prior year period. Correspondingly, total ore milled was 347,901 tonnes, up 3% compared to 337,213 tonnes. Average head grades were 305 g/t for silver, 4.7% for lead, and 1.1% for zinc compared to 252 g/t for silver, 3.7% for lead, and 0.8% for zinc, respectively.
During the same time periods, the Ying Mining District sold approximately 3.1 million ounces of silver, 1,900 ounces of gold, 32.6 million pounds of lead, and 3.6 million pounds of zinc, compared to 2.3 million ounces of silver, 1,500 ounces of gold, 23.5 million pounds of lead, and 2.8 million pounds of zinc in prior year period.
For the six months ended September 30, 2016, the cash mining costs at the Ying Mining District was $50.70 per tonne, a decrease of 15% compared to $59.43 per tonne in the same prior year period. The cash milling cost was $9.44 per tonne, a decrease of 23% compared to $12.23 in the same prior year period.
Cash cost per ounce of silver and all in sustaining costs per ounce of silver, net of by-product credits, at the Ying Mining District, for the six months ended September 30, 2016, were negative $1.34 and $3.99 respectively, compared to $1.44 and $9.52 in the same prior year period.
In Q2 Fiscal 2017, approximately 22,188 meters (“m”) of underground diamond drilling (Q2 Fiscal 2016 – 22,846 m) and 5,333 m of preparation tunnelling (Q2 Fiscal 2016 – 6,507 m) were completed and expensed as mining preparation costs at the Ying Mining District. In addition, approximately 16,013 m of horizontal tunnel, raise, and declines (Q2 Fiscal 2016 – 17,271 m) were completed and capitalized. Total capitalized exploration and development expenditures in Q2 Fiscal 2017 for the Ying Mining District were $4.8 million compared to $5.7 million in Q2 Fiscal 2016.
For the six months ended September 30, 2016, approximately 35,038 m of underground diamond drilling (same prior year period – 39,212 m) and 10,169 m of preparation tunnelling (same prior year period – 12,563 m) were completed and expensed as mining preparation costs at the Ying Mining District. In addition, approximately 32,677 m of horizontal tunnel, raise, and declines (same prior year period – 35,790 m) were completed and capitalized. Total capitalized exploration and development expenditures for the six months ended September 30, 2016 for the Ying Mining District were $9.7 million compared to $11.8 million in same prior year period. The Company also paid $1.3 million to renew the mining permit for TLP and LM mine.
2. GC Mine, Guangdong Province, China
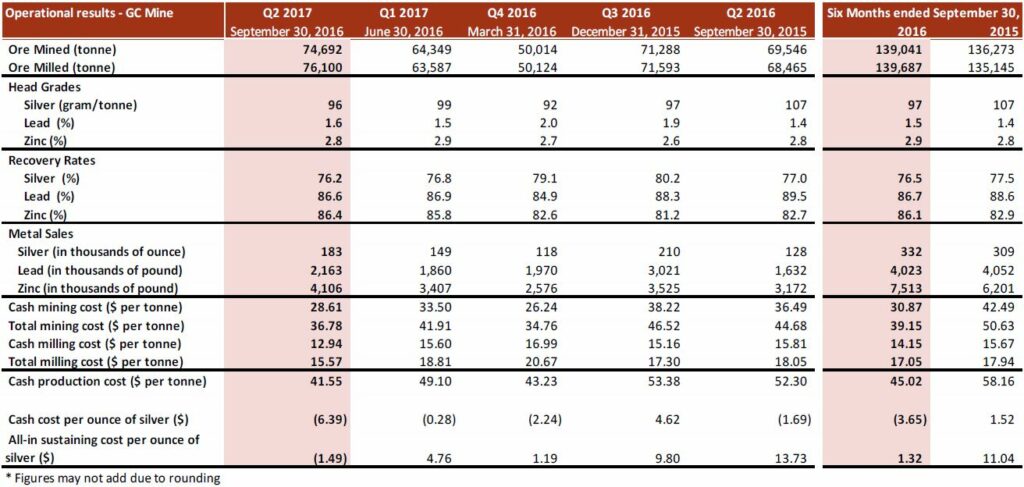
In Q2 Fiscal 2017, the Company mined 74,692 tonnes of ore at the GC Mine, an increase of 7% compared to 69,546 tonnes in Q2 Fiscal 2016. Head grades were 96 g/t for silver, 1.6% for lead and 2.8% for zinc, compared to 107 g/t for silver, 1.4% for lead and 2.8% for zinc in Q2 Fiscal 2016. The total mining cost and cash mining cost were $36.78 and $28.61, respectively, compared to $44.68 and $36.49 in Q2 Fiscal 2016. The decrease of cash mining costs was mainly because approximately 24% of ore was by-product ore from exploration tunnelling or extracted from previously mined stopes for which direct mining costs were paid in prior periods and the only cost involved was to ship the ore to the mill.
Total ore milled at the GC Mine in Q2 Fiscal 2017 was 76,100 tonnes, an increase of 11% compared to 68,465 tonnes in Q2 Fiscal 2016. The cash milling cost per tonne was $12.94, compared to $15.81 in Q2 Fiscal 2016, with the decrease mainly due to the exclusion of mineral resource tax from milling costs as discussed above.
Correspondingly, cash production cost per tonne of ore processed at the GC Mine was $41.55, a decrease of 21% compared to $52.30 in Q2 Fiscal 2016 as a result of the decrease in both per tonne cash mining and milling cost.
In Q2 Fiscal 2017, the GC Mine sold approximately 0.2 million ounces of silver, 2.2 million pounds of lead, and 4.1 million pounds of zinc, up 43%, 33% and 29% respectively, compared to 0.1 million ounces of silver, 1.6 million pounds of lead, and 3.2 million pounds of zinc in Q2 Fiscal 2016. The increase of metals sold at GC Mine was mainly due to higher output achieved.
Cash cost per ounce of silver, net of by-product credits, at the GC Mine, was negative $6.39 in Q2 Fiscal 2017 compared to negative $1.69 in Q2 Fiscal 2016. The decrease was mainly due to i) lower per tonne cash production costs as discussed above; and, ii) a 38% increase in by-product credits.
All in sustaining costs per ounce of silver, net of by-product credits, at the GC Mine in Q2 2017 was negative $1.49, compared to $13.73 in Q2 Fiscal 2016. The decrease was mainly due to: i) lower per tonne cash production cost and the increase of by-product credits as discussion above: and, ii) a $1.0 million decrease in sustaining capital expenditures.
For the six months ended September 30, 2016, the total ore mined at the GC Mine was 139,041 tonnes, an increase of 2% compared to 136,273 tonnes in the same prior year period. Correspondingly, total ore milled was 139,687 tonnes, an increase of 3% compared to 135,145 milled in the same prior year period. Average head grades were 97 g/t for silver, 1.5% for lead, and 2.9% for zinc compared to 107 g/t for silver, 1.4% for lead, and 2.8% for zinc, respectively.
During the same time periods, the GC Mine sold approximately 0.3 million ounces of silver, 4.0 million pounds of lead, and 7.5 million pounds of zinc, compared to 0.3 million ounces of silver, 4.1 million pounds of lead, and 6.2 million pounds of zinc in the same prior year period.
For the six months ended September 30, 2016, the cash mining costs at the GC Mine was $30.87 per tonne, a decrease of 27% compared to $42.49 per tonne in the same prior year period. The cash milling cost was $14.15 per tonne, a decrease of 10% compared to $15.67 in the same prior year period.
Cash cost per ounce of silver and all in sustaining costs per ounce of silver, net of by-product credits, at the GC Mine, for the six months ended September 30, 2016, were negative $3.65 and $1.32 respectively, compared to $1.52 and $11.04 in the same prior year period.
In Q2 Fiscal 2017, approximately 2,245 m of underground diamond drilling (Q2 Fiscal 2016 – 6,882 m) and 3,850 m of tunnelling (Q2 Fiscal 2016 – 3,082 m) were completed and expensed as mining preparation costs at the GC Mine. In addition, approximately 606 m of horizontal tunnel, raise, and declines (Q2 Fiscal 2016 – 530 m) were completed and capitalized. Total capitalized exploration and development expenditures in Q2 Fiscal 2017 for the GC Mine were $0.2 million compared to $0.3 million in Q2 Fiscal 2016.
For the six months ended September 30, 2016, approximately 5,554 m of underground diamond drilling (same prior year period – 14,298 m) and 7,336 m of tunnelling (same prior year period – 7,736 m) were completed and expensed as mining preparation costs at the GC Mine. In addition, approximately 1,188 m of horizontal tunnel, raise, and declines (same prior year period – 685 m) were completed and capitalized. Total capitalized exploration and development expenditures were $0.4 million compared to $0.5 million in the same prior year period.
The significant improvement in the head grades of silver, lead and zinc and improved cost structures since the December quarter of 2015 can be attributed in part to an internal “Enterprise Blog” system in the management of Mine Production and Safety Information which the Company implemented from August 2015.
The “Enterprise Blog” is an internet social media system that makes the distribution and flow of the work related knowledge and information easy and transparent for parties at different locations. In the system, for example, each of the mining stopes, development faces, or equipment is assigned a “blog” name. Daily results of onsite inspection for these stopes or faces by responsible engineers are required to be “published” on their “blogs”. The results are listed in a structured data formatted in a “check list table”, containing information and supporting photos as required by the Company. Related parties at different levels of the management team can access directly to the daily “blog” for each work place, for first hand information. Meanwhile the “Enterprise Blog” system will also record if a management person has accessed the “blog” to read or comment on the daily results under his responsibility.
With the Enterprise Blog, information collection, distribution, retrieval, and monitoring has become transparent and immediate. The information and knowledge collected by the frontline technicians or engineers freely flows throughout layers of the management structure. The responsible management person has the pressure, incentive, and tools to make prompt and more accurate decisions that can be instantly delivered to responsible parties. The benefits of the system are that team member collaboration becomes easy, KPI assessments are fair and timely, and each person is accountable for his work.
Alex Zhang, P.Geo., Vice President, Exploration, is the Qualified Person for Silvercorp under NI 43-101 and has reviewed and given consent to the technical information contained in this news release.
This earnings release should be read in conjunction with the Company’s Management Discussion & Analysis, Financial Statements and Notes to Financial Statements for the corresponding period, which have been posted on SEDAR at www.sedar.com and are also available on the Company’s website at www.silvercorp.ca. All figures are in United States dollars unless otherwise stated.
About Silvercorp
Silvercorp is a low-cost silver-producing Canadian mining company with multiple mines in China. The Company’s vision is to deliver shareholder value by focusing on the acquisition of under developed projects with resource potential and the ability to grow organically. For more information, please visit our website at www.silvercorp.ca.
For further information
Silvercorp Metals Inc.
Gordon Neal
Vice President, Corporate Development
Phone: (604) 669-9397
Toll Free: 1(888) 224-1881
Email: investor@silvercorp.ca
Website: http://silvercorpmetals.ca
CAUTIONARY DISCLAIMER – FORWARD LOOKING STATEMENTS
Certain of the statements and information in this press release constitute “forward-looking statements” within the meaning of the United States Private Securities Litigation Reform Act of 1995 and “forward-looking information” within the meaning of applicable Canadian provincial securities laws. Any statements or information that express or involve discussions with respect to predictions, expectations, beliefs, plans, projections, objectives, assumptions or future events or performance (often, but not always, using words or phrases such as “expects”, “is expected”, “anticipates”, “believes”, “plans”, “projects”, “estimates”, “assumes”, “intends”, “strategies”, “targets”, “goals”, “forecasts”, “objectives”, “budgets”, “schedules”, “potential” or variations thereof or stating that certain actions, events or results “may”, “could”, “would”, “might” or “will” be taken, occur or be achieved, or the negative of any of these terms and similar expressions) are not statements of historical fact and may be forward-looking statements or information. Forward-looking statements or information relate to, among other things: the price of silver and other metals; the accuracy of mineral resource and mineral reserve estimates at the Company’s material properties; the sufficiency of the Company’s capital to finance the Company’s operations; estimates of the Company’s revenues and capital expenditures; estimated production from the Company’s mines in the Ying Mining District; timing of receipt of permits and regulatory approvals; availability of funds from production to finance the Company’s operations; and access to and availability of funding for future construction, use of proceeds from any financing and development of the Company’s properties.
Forward-looking statements or information are subject to a variety of known and unknown risks, uncertainties and other factors that could cause actual events or results to differ from those reflected in the forward-looking statements or information, including, without limitation, risks relating to: fluctuating commodity prices; calculation of resources, reserves and mineralization and precious and base metal recovery; interpretations and assumptions of mineral resource and mineral reserve estimates; exploration and development programs; feasibility and engineering reports; permits and licences; title to properties; property interests; joint venture partners; acquisition of commercially mineable mineral rights; financing; recent market events and conditions; economic factors affecting the Company; timing, estimated amount, capital and operating expenditures and economic returns of future production; integration of future acquisitions into the Company’s existing operations; competition; operations and political conditions; regulatory environment in China and Canada; environmental risks; foreign exchange rate fluctuations; insurance; risks and hazards of mining operations; key personnel; conflicts of interest; dependence on management; internal control over financial reporting as per the requirements of the Sarbanes-Oxley Act; and bringing actions and enforcing judgments under U.S. securities laws.
This list is not exhaustive of the factors that may affect any of the Company’s forward-looking statements or information. Forward-looking statements or information are statements about the future and are inherently uncertain, and actual achievements of the Company or other future events or conditions may differ materially from those reflected in the forward-looking statements or information due to a variety of risks, uncertainties and other factors, including, without limitation, those referred to in the Company’s Annual Information Form for the year ended March 31, 2016 under the heading “Risk Factors”. Although the Company has attempted to identify important factors that could cause actual results to differ materially, there may be other factors that cause results not to be as anticipated, estimated, described or intended. Accordingly, readers should not place undue reliance on forward-looking statements or information.
The Company’s forward-looking statements and information are based on the assumptions, beliefs, expectations and opinions of management as of the date of this press release, and other than as required by applicable securities laws, the Company does not assume any obligation to update forward-looking statements and information if circumstances or management’s assumptions, beliefs, expectations or opinions should change, or changes in any other events affecting such statements or information. For the reasons set forth above, investors should not place undue reliance on forward-looking statements and information.