VANCOUVER, British Columbia – May 21, 2020 – Silvercorp Metals Inc. (“Silvercorp” or the “Company”) (TSX: SVM) (NYSE American: SVM) reported its financial and operating results for the fourth quarter and twelve months ended March 31, 2020 (“Fiscal 2020”). All amounts are expressed in US Dollars.
Despite the extended shut-down during the three months ended March 31, 2020 (“Q4 Fiscal 2020”) due to COVID-19, the Company was able to achieve full year production target, surpassing its Fiscal 2020 guidance. As reported in the Company’s news release dated May 7, 2020, the Company’s operations were ramped up to full capacity in March 2020 with no employee infection and the Company is in full compliance with government measures to prevent spread of COVID-19.
FISCAL YEAR 2020 HIGHLIGHTS
- Silver, lead and zinc production surpassed annual guidance by 3%, 3% and 17%; respectively;
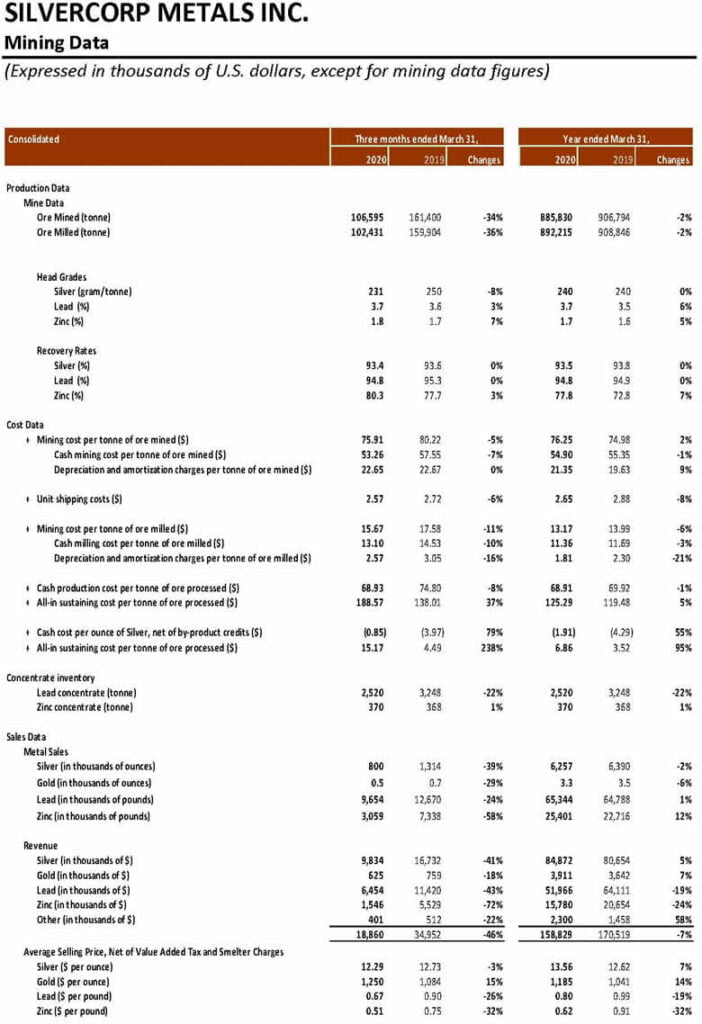
- Ore mined down 2% to 885,830 tonnes compared to the prior year;
- Sold approximately 6.3 million ounces of silver, 3,300 ounces of gold, 65.3 million pounds of lead, and 25.4 million pounds of zinc, representing a decrease of 2% and 6% in silver and gold sold and an increase of 1% and 12% in lead and zinc sold compared to the prior year;
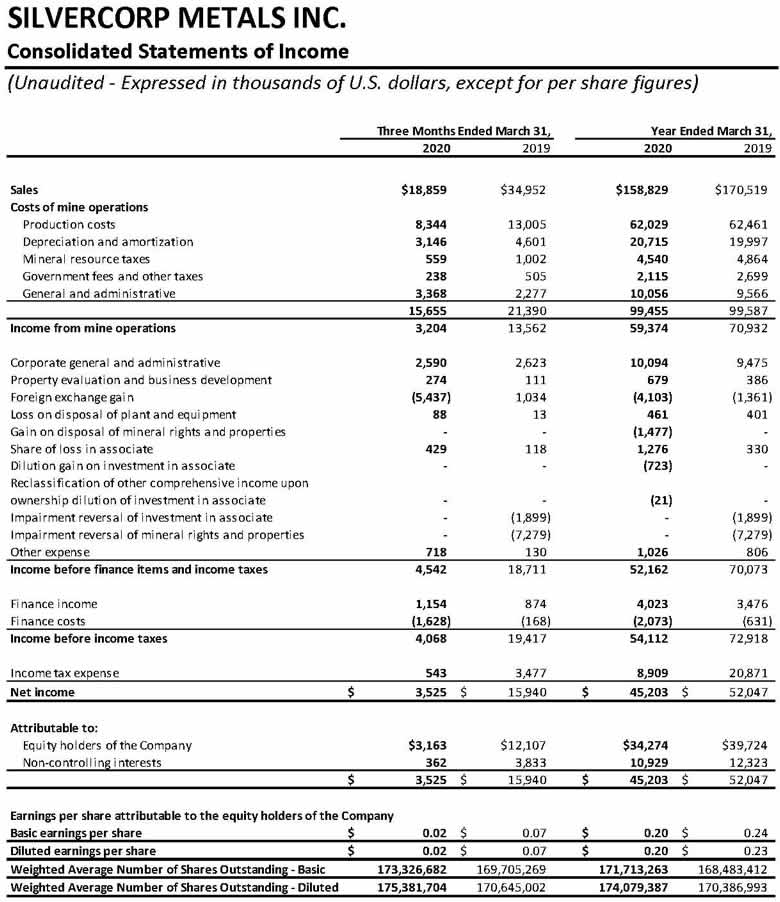
- Revenue of $158.8 million, down 7%, compared to $170.5 million in the prior year;
- Net income attributable to equity shareholders of $34.3 million or $0.20 per share compared to $39.7 million or $0.23 per share in the prior year. Excluding the impairment reversal of $9.2 million recorded in Fiscal 2019, the net income to equity shareholders in Fiscal 2020 was up 6% compared to the adjusted net income attributable to equity shareholders1 of $32.2 million, or $0.19 per share, in the prior year. In Fiscal 2020, the Company’s consolidated financial results were impacted mainly by operations in China being suspended for an extra month in Q4 Fiscal 2020 due to COVID-19;
- Cash cost per ounce of silver1, net of by-product credits, of negative $1.91 compared to negative $4.29 in the prior year;
- All-in sustaining cost per ounce of silver1, net of by-product credits, of $6.86, compared to $3.52 in the prior year;
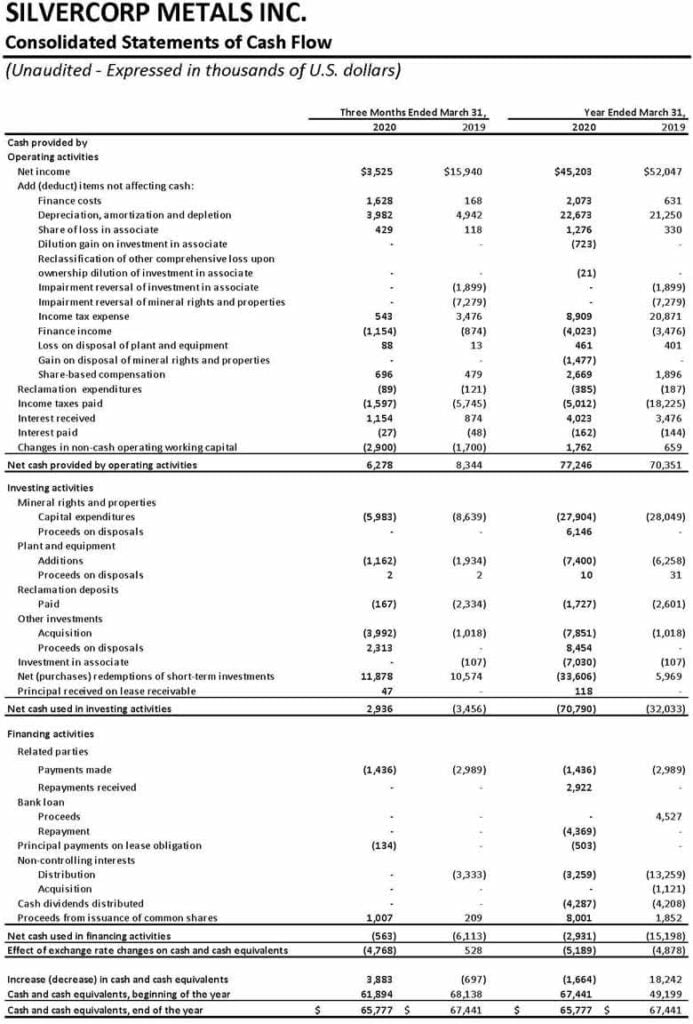
- Cash flow from operations of $77.2 million, up 10% compared to $70.4 million in the prior year;
- Paid $4.3 million of dividends to the Company’s shareholders, compared to $4.2 million in the prior year;
- Invested $7.0 million in New Pacific Metals Corp. (“NUAG”) to maintain the Company’s ownership interest at 28.8%; and
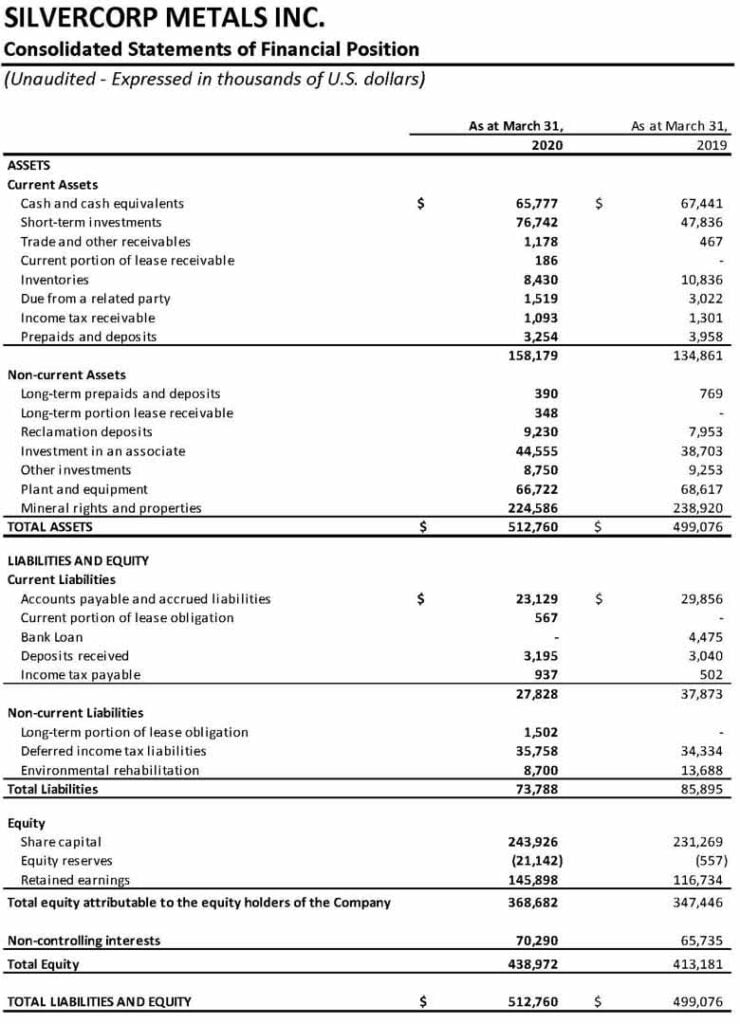
- Strong balance sheet with $142.5 million in cash and cash equivalents and short-term investments, an increase of $27.2 million or 24% compared to $115.3 million as at March 31, 2019.
HIGHLIGHTS FOR Q4 FISCAL 2020
- Ore mined down 34% to 106,595 tonnes compared to the prior year quarter;
- Sold approximately 0.8 million ounces of silver, 500 ounces of gold, 9.7 million pounds of lead, and 3.1 million pounds of zinc, down 39%, 29%, 24%, and 58% respectively, compared to approximately 1.3 million ounces of silver, 700 ounces of gold, 12.7 million pounds of lead, and 7.3 million pounds of zinc in the prior year quarter.
- Revenue of $18.9 million, down 46% compared to $35.0 million in the prior year quarter;
- Net income attributable to equity shareholders of $3.2 million, or $0.02 per share, compared to the adjusted net income attributable to equity shareholders of $4.6 million or $0.03 per share, in the prior year quarter. In Q4 Fiscal 2020, the Company’s consolidated financial results were impacted mainly by the decrease in metal prices and operations in China being suspended for an extra month due to COVID-19;
- Cash cost per ounce of silver, net of by-product credits, of negative $0.85 compared to negative $3.97 in the prior year quarter;
- All-in sustaining cost per ounce of silver, net of by-product credits, of $15.17, compared to $4.49 in the prior year quarter; and
- Cash flow from operations of $6.3 million, compared to $8.3 million in the prior year quarter.
FINANCIALS
1. Fiscal 2020 vs. Fiscal 2019
Net income attributable to equity shareholders of the Company in Fiscal 2020 was $34.3 million or $0.20 per share, compared to $39.7 million or $0.23 per share in Fiscal 2019. Excluding the impairment reversal of $9.2 million recorded in Fiscal 2019, the net income attributable to equity shareholders in Fiscal 2020 was up 6% compared to the adjusted net income attributable to equity shareholders of $32.2 million, or $0.19 per share in Fiscal 2019.
In Fiscal 2020, the Company’s consolidated financial results were mainly impacted by i) operations in China being suspended for an extra month in Q4 Fiscal 2020 due to COVID-19; ii) an increase of 1% and 12% in lead and zinc sold, offset by a 2% decrease in silver sold, respectively; iii) an increase of 7%, in the realized selling price for silver, offset by decreases of 19% and 32% in the realized selling prices for lead and zinc, respectively; and iv) an increase of $2.7 million in foreign exchange gain arising from the appreciation of the US dollar against the Canadian dollar.
Revenue in Fiscal 2020 was $158.8 million, down $11.7 million compared to $170.5 million in Fiscal 2019. The decrease was mainly due to the decrease in the realized selling prices for lead and zinc. Revenue from silver and gold was $84.9 million and $3.9 million, up 5% and 7%, respectively, compared to $80.7 million and $3.6 million in Fiscal 2019, while revenue from lead and zinc was $52.0 million and $15.8 million, down 19% and 24%, compared to $64.1 and 20.7 million in Fiscal 2019.
Production costs expensed in Fiscal 2020 were $62.0 million, a slight decrease compared to $62.5 million in Fiscal 2019. The production costs expensed represent approximately 900,000 tonnes of ore processed and expensed at a cost of $68.91 per tonne, compared to approximately 893,000 tonnes at $69.92 per tonne in Fiscal 2019.
Mineral resource taxes in Fiscal 2020 were $4.5 million, compared to $4.9 million in Fiscal 2019, and the decrease was mainly due to lower revenue.
Government fees and other taxes in Fiscal 2020 were $2.1 million compared to $2.7 million in Fiscal 2019. Government fees and other taxes are comprised of environmental protection fees, surtaxes on value-added tax, land usage levies, stamp duties and other miscellaneous levies, duties and taxes imposed by the state and local Chinese governments.
Income from mine operations in Fiscal 2020 was $59.4 million, or 37% of revenue, compared to $70.9 million or 42% of revenue in Fiscal 2019. The decrease was mainly due to the decrease in the realized selling prices for lead and zinc. Income from mine operations at the Ying Mining District was $54.1 million or 41% of revenue, compared to $65.2 million or 46% of revenue in Fiscal 2019. Income from mine operations at the GC Mine was $5.7 million or 21% of revenue, compared to $7.5 million or 26% of revenue in Fiscal 2019.
General and administrative expenses in Fiscal 2020 were $20.2 million, an increase of $1.1 million or 6%, compared to $19.0 million in Fiscal 2019. The increase was mainly due to an increase of $0.7 million in share-based compensation expenses and an increase of $0.7 million in amortization and depreciation expenses. General and administrative expenses include corporate administrative expenses of $10.1 million (Fiscal 2019 – $9.5 million) and mine administrative expenses of $10.1 million (Fiscal 2019 – $9.6 million).
Income tax expenses in Fiscal 2020 were $8.9 million, compared to $20.9 million in Fiscal 2019. The income tax expense recorded in Fiscal 2020 included a current income tax expense of $5.6 million (Fiscal 2019 – $17.8 million) and a deferred income tax expense of $3.3 million (Fiscal 2019 – $3.1 million). The current income tax included $2.8 million of withholding tax (Fiscal 2019 – $5.2 million), which was paid at a rate of 10% on dividends and interest distributed out of China. The decrease in income tax expenses was mainly due to the tax benefit realized arising from the disposal of the XHP project and less income from mine operations.
Cash flow provided by operating activities in Fiscal 2020 was $77.2 million, up $6.9 million or 10% compared to $70.4 million in Fiscal 2019.
The Company ended the fiscal year with $142.5 million in cash, cash equivalents and short-term investments, an increase of $27.2 million or 24%, compared to $115.3 million as at March 31, 2019.
Working capital as at March 31, 2020 was $130.4 million, an increase of $33.4 million or 34%, compared to $97.0 million as at March 31, 2019.
2. Q4 Fiscal 2020 vs. Q4 Fiscal 2019
Net income attributable to equity shareholders of the Company in Q4 Fiscal 2020 was $3.2 million or $0.02 per share, compared to $12.1 million or $0.07 per share in Q4 Fiscal 2019. Excluding the impairment reversal of $9.2 million recorded in Q4 Fiscal 2019, the adjusted net income attributable to equity shareholders was $4.6 million or $0.03 per share in Q4 Fiscal 2019.
Compared to the prior year quarter, the Company’s consolidated financial results in Q4 Fiscal 2020 were mainly impacted by the following: i) operations in China being suspended for an extra month due to COVID-19; ii) a decrease of 3%, 26%, and 32% in the net realized selling price of silver, lead and zinc; and iii) a foreign exchange gain of $5.4 million recorded arising from the appreciation of the US dollar against the Canadian dollar.
Revenue in Q4 Fiscal 2020 was $18.9 million, down 46%, compared to $35.0 million in Q4 Fiscal 2019. The decrease was mainly due to lower production and the decrease in net realized selling prices. Revenue from silver and gold was $9.8 million and $0.6 million, respectively, compared to $16.7 million and $0.8 million in Q4 Fiscal 2019, while revenue from base metals was $8.4 million, compared to $17.5 million in Q4 Fiscal 2019.
Production costs expensed in Q4 Fiscal 2020 were $8.3 million, compared to $13.0 million in Q4 Fiscal 2019. The decrease was mainly due to less metal sold in the current quarter. The production costs expensed in Q4 Fiscal 2019 represent approximately 121,000 tonnes of ore processed and expensed at a cost of $68.93 per tonne, compared to 174,000 tonnes at a cost of $74.80 per tonne in Q4 Fiscal 2019.
Income from mine operations in Q4 Fiscal 2020 was $3.2 million or 17% of revenue, compared to $13.6 million or 39% of revenue in Q4 Fiscal 2019. The decrease was mainly due to the decrease in metal sold and realized selling prices. Income from mine operations at the Ying Mining District was $3.1 million or 20% of revenue, compared to $12.2 million or 44% of revenue in Q4 Fiscal 2019. Income from mine operations at the GC Mine was $0.2 million or 7% of revenue, compared to $1.7 million or 24% of revenue in Q4 Fiscal 2019.
Cash flows provided by operating activities in Q4 Fiscal 2020 were $6.3 million, a decrease of $2.0 million, compared to $8.3 million in Q4 Fiscal 2019.
OPERATIONS AND DEVELOPMENT
1. Fiscal 2020 vs. Fiscal 2019
In Fiscal 2020, on a consolidated basis, the Company mined 885,830 tonnes of ore, a decrease of 2% or 20,964 tonnes, compared to 906,794 tonnes in Fiscal 2019. Ore milled in Fiscal 2020 was 892,215 tonnes, a decrease of 2% or 16,631 tonnes compared to 908,846 tonnes in Fiscal 2019.
The Company sold approximately 6.3 million ounces of silver, 3,300 ounces of gold, 65.3 million pounds of lead, and 25.4 million pounds of zinc, representing a decrease of 2% and 6% in silver and gold sold and an increase of 1% and 12% in lead and zinc sold, respectively, compared to 6.4 million ounces of silver, 3,500 ounces of gold, 64.8 million pounds of lead, and 22.7 million pounds of zinc in Fiscal 2019.
In Fiscal 2020, the consolidated total mining cost and cash mining cost were $76.25 and $54.90 per tonne, up 2% and down 1%, respectively, compared to $74.98 and $55.35 per tonne, respectively, in Fiscal 2019. The decrease in the cash mining cost was mainly due to a decrease of 5% in mining preparation costs, offset by an increase of 3% in direct mining contractors’ cost.
The consolidated total milling cost and cash milling cost were $13.17 and $11.36 per tonne, down 6% and 3%, respectively, compared to $13.99 and $11.69 per tonne, respectively, in Fiscal 2019. The improvement in the cash milling cost was mainly due to decreases of 4% in utility costs and 6% in raw material costs.
The consolidated cash production cost per tonne of ore processed in Fiscal 2020 was $68.91, a decrease of 1% compared to $69.92 in Fiscal 2019 and 4% below the Company’s annual guidance. The consolidated all-in sustaining production cost per tonne of ore processed was $125.29, an increase of 5% compared to $119.48 in Fiscal 2019, but in line with the Company’s annual guidance.
In Fiscal 2020, the consolidated cash cost per ounce of silver, net of by-product credits, was negative $1.91, compared to negative $4.29 in the prior year. The increase was mainly due to a decrease of $15.9 million in by-product credits. The decrease in by-product credits was mainly due to a decrease of 19% and 32%, respectively, in net realized selling prices for lead and zinc, partially offset by an increase of 1% and 12% in lead and zinc sold. Sales from lead and zinc in Fiscal 2020 amounted to $67.7 million, a decrease of $17.1 million, compared to $84.8 million in Fiscal 2019.
The consolidated all-in sustaining cost per ounce of silver, net of by-product credits, was $6.86, compared to $3.52 in Fiscal 2019. The increase was mainly due to the increase in the cash cost per ounce of silver as discussed above and an increase of $4.7 million in sustaining capital expenditures.
2. Q4 Fiscal 2020 vs. Q4 Fiscal 2019
In Q4 Fiscal 2020, the Company mined 106,595 tonnes of ore, a decrease of 34%, compared to 161,400 tonnes in Q4 Fiscal 2019. Ore milled in Q4 Fiscal 2020 was 102,431 tonnes, a decrease of 36% compared to 159,904 tonnes in Q4 Fiscal 2019.
In Q4 Fiscal 2020, the Company sold approximately 0.8 million ounces of silver, 500 ounces of gold, 9.7 million pounds of lead, and 3.1 million pounds of zinc, down 39%, 29%, 24%, and 58%, respectively, compared to approximately 1.3 million ounces of silver, 700 ounces of gold, 12.7 million pounds of lead, and 7.3 million pounds of zinc in Q4 Fiscal 2019.
In Q4 Fiscal 2020, the consolidated total mining cost and cash mining cost were $75.91 and $53.26 per tonne, down 5% and 7%, respectively, compared to $80.22 and $57.55 per tonne in Q4 Fiscal 2019. The consolidated total milling cost and cash milling cost in Q4 Fiscal 2020 were $15.67 and $13.10 per tonne, down 11% and 10%, respectively, compared to $17.58 and $14.53 per tonne in Q4 Fiscal 2019. The consolidated all-in sustaining production cost per tonne was $188.57, up 37%, compared to $138.01 in Q4 Fiscal 2019. The increase was mainly due to lower production resulting in higher per tonne fixed cost allocation. The all-in sustaining production cost in Q4 Fiscal 2020 was $19.6 million, a decrease of $2.6 million, compared to $22.2 million in Q4 Fiscal 2019.
In Q4 Fiscal 2020, the consolidated cash cost per ounce of silver, net of by-product credits, was negative $0.85, compared to negative $3.97 in Q4 Fiscal 2019. The increase was mainly due to a decrease of $9.2 million in by-product credits.
In Q4 Fiscal 2020, the consolidated all-in sustaining cost per ounce of silver, net of by-product credits, was $15.17, compared to $4.49 in Q4 Fiscal 2019. The increase was mainly due to i) a decrease of $9.2 million in by-product credits; ii) less silver sold resulting in a higher per ounce cost, and partially offset by iii) a decrease of $2.2 million in all-in sustaining production cost.
3. Ying Mining District, Henan Province, China
Fiscal 2020 vs. Fiscal 2019
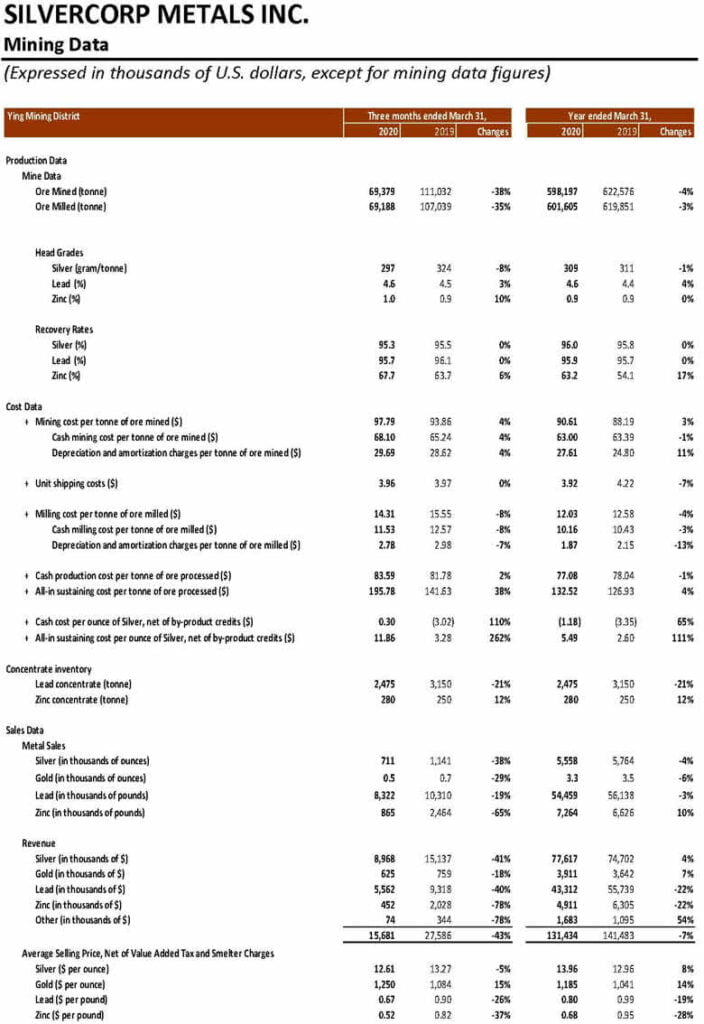
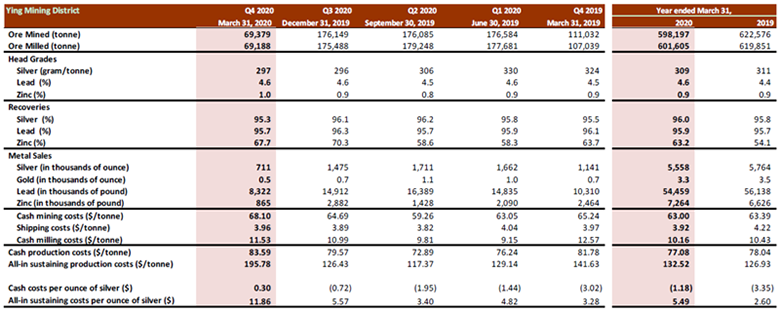
In Fiscal 2020, the total ore mined at the Ying Mining District was 598,197 tonnes, a decrease of 4% or 24,379 tonnes, compared to 622,576 tonnes mined in Fiscal 2019. Ore milled was 601,605 tonnes, a decrease of 3% or 18,246 tonnes, compared to 619,851 tonnes in Fiscal 2019.
Head grades of ore milled at the Ying Mining District in Fiscal 2020 were 309 grams per tonne (“g/t”) for silver, 4.6% for lead, and 0.9% for zinc, compared to 311 g/t for silver, 4.4% for lead, and 0.9% for zinc in Fiscal 2019.
In Fiscal 2020, the Ying Mining District sold approximately 5.6 million ounces of silver, 3,300 ounces of gold, and 54.5 million pounds of lead, down 4%, 6%, and 3%, respectively, compared to 5.8 million ounces of silver, 3,500 ounces of gold, and 56.1 million pounds of lead in Fiscal 2019 while zinc sold was 7.3 million pounds in Fiscal 2020, up 10% compared to 6.6 million pounds in Fiscal 2019.
Total mining cost and cash mining cost per tonne at the Ying Mining District in Fiscal 2020 were $90.61 and $63.00 per tonne, respectively, compared to $88.19 and $63.39 per tonne, respectively, in Fiscal 2019. Total milling cost and cash milling cost per tonne at the Ying Mining District in Fiscal 2020 were $12.03 and $10.16, down by 4% and 3%, respectively, compared to $12.58 and $10.43, respectively, in Fiscal 2019.
Correspondingly, the cash production cost per tonne of ore processed at the Ying Mining District in Fiscal 2020 was $77.08, down 1% compared to $78.04 in Fiscal 2019. The all-in sustaining cost per tonne of ore processed was $132.52, up 4%, compared to $126.93 in Fiscal 2019. The increase was mainly due to an increase of $2.9 million in sustaining capital expenditures.
Cash cost per ounce of silver, net of by-product credits, at the Ying Mining District in Fiscal 2020, was negative $1.18 compared to negative $3.35 in Fiscal 2019. The increase was mainly due to a decrease of $13.0 million in by-product credits.
All-in sustaining cost per ounce of silver, net of by-product credits, at the Ying Mining District in Fiscal 2020 was $5.49 compared to $2.60 in the prior year. The increase was mainly due to the increase in cash cost per ounce of silver as discussed above and an increase of $2.9 million in sustaining capital expenditures.
In Fiscal 2020, approximately 85,643 metres or $2.5 million worth of underground diamond drilling (Fiscal 2019 – 75,955 metres or $1.8 million) and 19,088 metres or $5.7 million worth of preparation tunnelling (Fiscal 2019 – 18,656 metres or $5.4 million) were completed and expensed as mining preparation costs at the Ying Mining District. In addition, approximately 70,240 metres or $23.9 million worth of horizontal tunnels, raises, ramps and declines (Fiscal 2019 – 65,653 metres or $23.2 million) were completed and capitalized.
Q4 Fiscal 2020 vs. Q4 Fiscal 2019
In Q4 Fiscal 2020, a total of 69,379 tonnes of ore were mined at the Ying Mining District, a decrease of 38% or 41,653 tonnes, compared to 111,032 tonnes in Q4 Fiscal 2019. Ore milled was 69,188 tonnes, a decrease of 35% or 37,851 tonnes, compared to 107,039 tonnes in Q4 Fiscal 2019.
Average head grades of ore processed were 297 g/t for silver, 4.6% for lead, and 1.0% for zinc compared to 324 g/t for silver, 4.5% for lead, and 0.9% for zinc in Q4 Fiscal 2019.
Metals sold were approximately 0.7 million ounces of silver, 500 ounces of gold, 8.3 million pounds of lead, and 0.9 million pounds of zinc, compared to 1.1 million ounces of silver, 700 ounces of gold, 10.3 million pounds of lead, and 2.5 million pounds of zinc in Q4 Fiscal 2019.
In Q4 Fiscal 2020, the cash mining cost at the Ying Mining District was $68.1 per tonne, up 4% compared to $65.24 in Q4 Fiscal 2019. The cash milling cost was $11.53 per tonne, down 8% compared to $12.57 in Q4 Fiscal 2019.
Correspondingly, the cash production cost per tonne of ore processed at the Ying Mining District in Q4 Fiscal 2020 was $83.59, up 2% compared to $81.78 in Q4 Fiscal 2019. The all-in sustaining cost per tonne of ore processed was $195.78, up 38%, compared to $141.63 in Q4 Fiscal 2019. The increase was mainly due to lower production output resulting in a higher per tonne fixed cost allocation. The all-in sustaining production cost at the Ying Mining District was $13.6 million, a decrease of $1.9 million, compared to $15.4 million in Q4 Fiscal 2019.
In Q4 Fiscal 2020, the cash cost per ounce of silver and all in sustaining cost per ounce of silver, net of by-product credits, at the Ying Mining District were $0.30 and $11.86, respectively, compared to negative $3.02 and $3.28 in Q4 Fiscal 2019.
In Q4 Fiscal 2020, approximately 12,412 metres or $0.4 million worth of underground diamond drilling (Q4 Fiscal 2019 – 6,083 metres or $0.3 million) and 1,810 metres or $0.6 million worth of preparation tunnelling (Q4 Fiscal 2019 – 3,061 metres or $1.0 million) were completed and expensed as mining preparation costs at the Ying Mining District. In addition, approximately 7,979 metres or $2.9 million worth of horizontal tunnels, raises, ramps, and declines (Q4 Fiscal 2019 – 10,730 metres or $4.0 million) were completed and capitalized.
4. GC Mine, Guangdong Province, China
Fiscal 2020 vs. Fiscal 2019
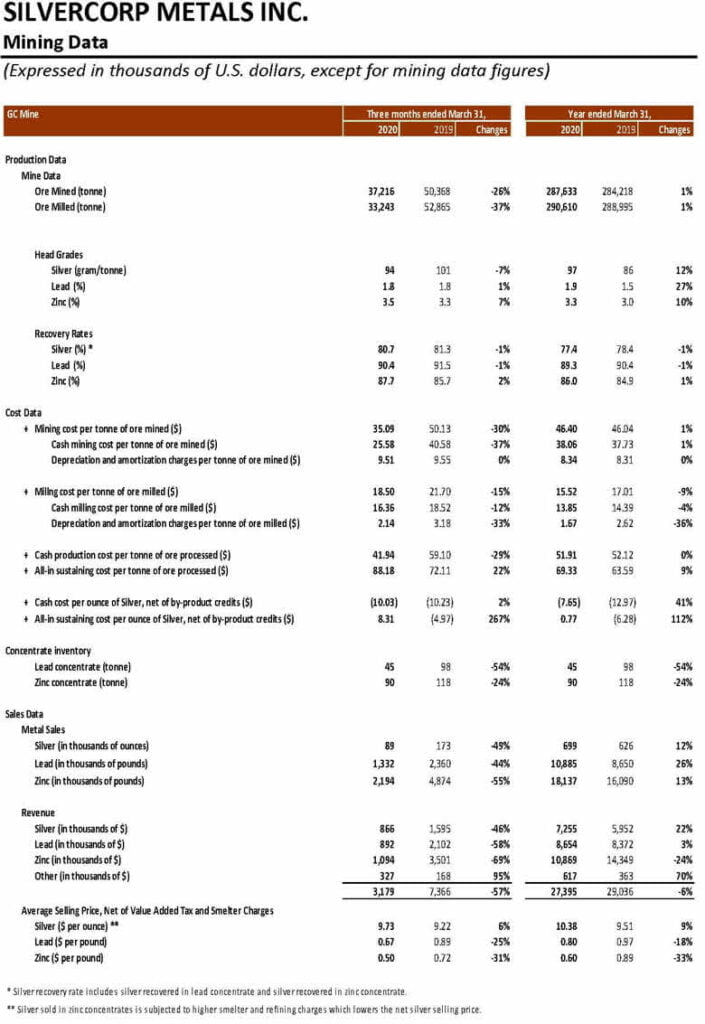
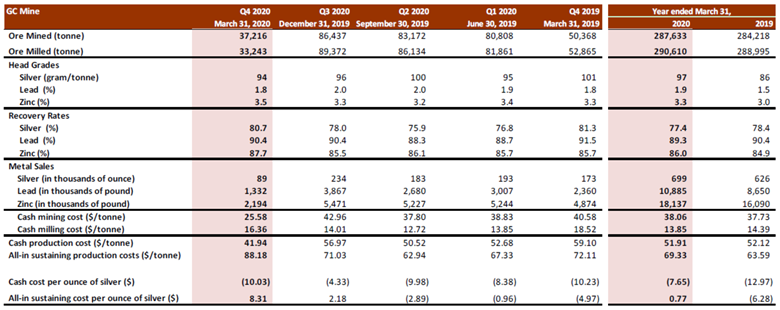
In Fiscal 2020, the total ore mined at the GC Mine was 287,633 tonnes, an increase of 1% or 3,415 tonnes, compared to 284,218 tonnes in Fiscal 2019, while ore milled was 290,610 tonnes, an increase of 1% or 1,615 tonnes, compared to 288,995 tonnes in Fiscal 2019.
Average head grades of ore processed at the GC Mine were 97 g/t for silver, 1.9% for lead, and 3.3% for zinc, compared to 86 g/t for silver, 1.5% for lead, and 3.0% for zinc in the prior year. Recovery rates for ore processed at the GC Mine were 77.4% for silver, 89.3% for lead, and 86.0% for zinc, compared to 78.4% for silver, 90.4% for lead, and 84.9% for zinc in Fiscal 2019.
In Fiscal 2020, the GC Mine sold 699,000 ounces of silver, 10.9 million pounds of lead, and 18.1 million pounds of zinc, up 12%, 26%, and 13%, respectively, compared to 626,000 ounces of silver, 8.7 million pounds of lead, and 16.1 million pounds of zinc in Fiscal 2019.
Total mining cost and cash mining cost at the GC Mine in Fiscal 2020 were $46.40 and $38.06 per tonne, respectively, a slight increase of 1% compared to $46.04 and $37.73 per tonne, respectively, in Fiscal 2019. Total milling cost and cash milling cost per tonne at the GC Mine were $15.52 and $13.85, respectively, down 9% and 4%, compared to $17.01 and $14.39, respectively, in Fiscal 2019.
Correspondingly, the cash production cost per tonne of ore processed at the GC Mine in Fiscal 2020 was $51.91, a slight decrease compared to $52.12 in Fiscal 2019. All-in sustaining production cost per tonne of ore processed was $69.57, up 9%, compared to $63.59 in Fiscal 2019. The increase was mainly due to an increase of $1.3 million in sustaining capital expenditures.
Cash cost per ounce of silver, net of by-product credits, at the GC Mine, was negative $7.65 compared to negative $12.97 in the prior year. The increase was mainly due to a decrease of $2.9 million in by-product credits resulting from a decrease of 18% and 33%, respectively, in the net realized selling prices for lead and zinc, offset by an increase of 26% and 13%, respectively, in lead and zinc sold.
All-in sustaining cost per ounce of silver, net of by-product credits, at the GC Mine in Fiscal 2020 was $0.77 compared to negative $6.28 in the prior year. The increase was mainly due to i) the increase in cash cost per ounce of silver as discussed above, ii) an increase of $0.8 million in general and administrative expenses, and iii) an increase of $1.3 million in sustaining capital expenditures.
In Fiscal 2020, approximately 22,513 metres or $1.0 million worth of underground diamond drilling (Fiscal 2019 – 24,727 metres or $1.3 million) and 19,315 metres or $4.6 million worth of tunnelling (Fiscal 2019 – 19,844 metres or $5.2 million) were completed and expensed as mining preparation costs at the GC Mine. In addition, approximately 3,327 metres or $2.4 million of horizontal tunnels, raises, ramps, and declines (Fiscal 2019 – 1,374 metres or $1.0 million) were completed and capitalized.
Q4 Fiscal 2020 vs. Q4 Fiscal 2019
In Q4 Fiscal 2020, a total of 37,216 tonnes of ore were mined and 33,243 tonnes were milled at the GC Mine, down 26% and 37%, respectively, compared to 50,368 tonnes mined and 52,865 tonnes milled in Q4 Fiscal 2019.
Average head grades of ore milled were 94 g/t for silver, 1.8% for lead, and 3.5% for zinc compared to 101 g/t for silver, 1.8% for lead, and 3.3% for zinc in Q4 Fiscal 2019.
Metals sold were approximately 89,000 ounces of silver, 1.3 million pounds of lead, and 2.2 million pounds of zinc, down 49%, 44%, and 55%, respectively, compared to 173,000 ounces of silver, 2.4 million pounds of lead, and 4.9 million pounds of zinc in Q4 Fiscal 2019.
The cash mining cost at the GC Mine was $25.58 per tonne, down 37% compared to $40.58 per tonne in Q4 Fiscal 2019. The decrease was mainly due to the decrease in tunneling expensed as mining preparation costs. The cash milling cost was $16.36 per tonne, down 12% compared to $18.52 in Q4 Fiscal 2019. Correspondingly, the cash production cost per tonne decreased by 29% to $41.94 from $59.10 in Q4 Fiscal 2019, while the all-in sustaining production cost per tonne of ore processed increased by 22% to $88.18 from $72.11 in Q4 Fiscal 2019. The increase in all-in sustaining production cost was mainly due to less production output resulting in a higher per tonne fixed cost allocation.
Cash cost per ounce of silver and all-in sustaining cost per ounce of silver, net of by‐product credits, at the GC Mine in Q4 Fiscal 2020, were negative $10.03 and $8.31, respectively, compared to negative $10.23 and negative $4.97 in Q4 Fiscal 2019. The increase was mainly due to i) a decrease of $3.5 million in by-product credits, ii) an increase of $0.5 million in general and administrative expenses, and iii) an increase of $0.6 million in sustaining capital expenditures.
In Q4 Fiscal 2020, approximately 2,200 metres or $0.1 million worth of underground diamond drilling (Q4 Fiscal 2019 – 2,864 metres or $0.3 million) and 353 metres or $0.1 million of tunnelling (Q4 Fiscal 2019 – 3,366 metres or $0.9 million) were completed and expensed as mining preparation costs at the GC Mine. In addition, approximately 1,851 metres or $1.4 million of horizontal tunnels, raise, and declines (Q4 Fiscal 2019 – 262 metres or $0.2 million) were completed and capitalized.
Mr. Guoliang Ma, P.Geo., Manager of Exploration and Resources of the Company, is the Qualified Person as defined by National Instrument 43-101 – Standards of Disclosure for Mineral Projects (“NI 43-101”) and has reviewed and given consent to the technical information contained in this news release.
This earnings release should be read in conjunction with the Company’s Management Discussion & Analysis, Financial Statements and Notes to Financial Statements for the corresponding period, which have been posted on SEDAR under the Company’s profile at www.sedar.com and are also available on the Company’s website at www.silvercorp.ca.
About Silvercorp
Silvercorp is a profitable Canadian mining company producing silver, lead and zinc metals in concentrates from mines in China. The Company’s goal is to continuously create healthy returns to shareholders through efficient management, organic growth and the acquisition of profitable projects. Silvercorp balances profitability, social and environmental relationships, employees’ wellbeing, and sustainable development. For more information, please visit our website at www.silvercorp.ca.
For further information
Silvercorp Metals Inc.
Lon Shaver
Vice President
Phone: (604) 669-9397
Toll Free: 1(888) 224-1881
Email: investor@silvercorp.ca
Website: www.silvercorp.ca
CAUTIONARY DISCLAIMER – FORWARD-LOOKING STATEMENTS
Certain of the statements and information in this news release constitute “forward-looking statements” within the meaning of the United States Private Securities Litigation Reform Act of 1995 and “forward-looking information” within the meaning of applicable Canadian provincial securities laws (collectively, “forward-looking statements”). Any statements or information that express or involve discussions with respect to predictions, expectations, beliefs, plans, projections, objectives, assumptions or future events or performance (often, but not always, using words or phrases such as “expects”, “is expected”, “anticipates”, “believes”, “plans”, “projects”, “estimates”, “assumes”, “intends”, “strategies”, “targets”, “goals”, “forecasts”, “objectives”, “budgets”, “schedules”, “potential” or variations thereof or stating that certain actions, events or results “may”, “could”, “would”, “might” or “will” be taken, occur or be achieved, or the negative of any of these terms and similar expressions) are not statements of historical fact and may be forward-looking statements. Forward-looking statements relate to, among other things: the price of silver and other metals; the accuracy of mineral resource and mineral reserve estimates at the Company’s material properties; the sufficiency of the Company’s capital to finance the Company’s operations; estimates of the Company’s revenues and capital expenditures; estimated production from the Company’s mines in the Ying Mining District and the GC Mine; timing of receipt of permits and regulatory approvals; availability of funds from production to finance the Company’s operations; and access to and availability of funding for future construction, use of proceeds from any financing and development of the Company’s properties.
Forward-looking statements are subject to a variety of known and unknown risks, uncertainties and other factors that could cause actual events or results to differ from those reflected in the forward-looking statements, including, without limitation, risks relating to: global economic and social impact of COVID-19; fluctuating commodity prices; calculation of resources, reserves and mineralization and precious and base metal recovery; interpretations and assumptions of mineral resource and mineral reserve estimates; exploration and development programs; feasibility and engineering reports; permits and licences; title to properties; property interests; joint venture partners; acquisition of commercially mineable mineral rights; financing; recent market events and conditions; economic factors affecting the Company; timing, estimated amount, capital and operating expenditures and economic returns of future production; integration of future acquisitions into the Company’s existing operations; competition; operations and political conditions; regulatory environment in China and Canada; environmental risks; foreign exchange rate fluctuations; insurance; risks and hazards of mining operations; key personnel; conflicts of interest; dependence on management; internal control over financial reporting; and bringing actions and enforcing judgments under U.S. securities laws.
This list is not exhaustive of the factors that may affect any of the Company’s forward-looking statements. Forward-looking statements are statements about the future and are inherently uncertain, and actual achievements of the Company or other future events or conditions may differ materially from those reflected in the forward-looking statements due to a variety of risks, uncertainties and other factors, including, without limitation, those referred to in the Company’s Annual Information Form under the heading “Risk Factors”. Although the Company has attempted to identify important factors that could cause actual results to differ materially, there may be other factors that cause results not to be as anticipated, estimated, described or intended. Accordingly, readers should not place undue reliance on forward-looking statements.
The Company’s forward-looking statements are based on the assumptions, beliefs, expectations and opinions of management as of the date of this news release, and other than as required by applicable securities laws, the Company does not assume any obligation to update forward-looking statements if circumstances or management’s assumptions, beliefs, expectations or opinions should change, or changes in any other events affecting such statements. For the reasons set forth above, investors should not place undue reliance on forward-looking statements.