VANCOUVER, British Columbia – August 6, 2020 – Silvercorp Metals Inc. (“Silvercorp” or the “Company”) (TSX/NYSE American: SVM) reported its financial and operating results for the first quarter ended June 30, 2020 (“Q1 Fiscal 2021”). All amounts are expressed in US Dollars.
Q1 FISCAL YEAR 2021 HIGHLIGHTS
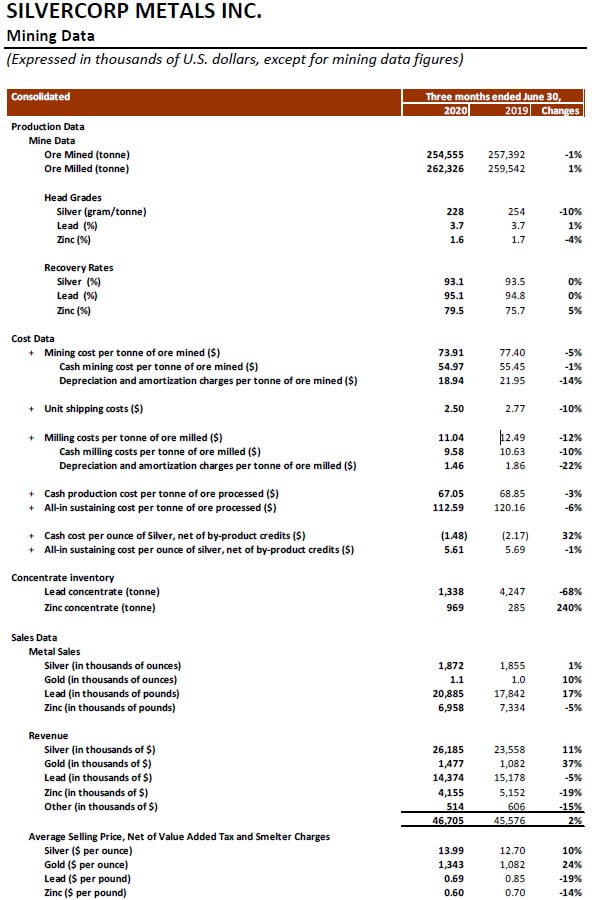
- Mined 254,555 tonnes of ore, down 1% compared to the prior year quarter;
- Sold approximately 1.9 million ounces of silver, 1,100 ounces of gold, 20.9 million pounds of lead, and 7.0 million pounds of zinc, representing an increase of 1%, 10%, and 17% in silver, gold and lead sold, and a decrease of 5% in zinc sold, compared to the prior year quarter;
- Revenue of $46.7 million, up 2% or $1.1 million compared to $45.6 million in the prior year quarter;
- Net income attributable to equity shareholders of $15.5 million, or $0.09 per share, compared to $12.6 million or $0.07 per share in the prior year quarter;
- Cash cost per ounce of silver1, net of by-product credits, of negative $1.48, compared to negative $2.17 in the prior year quarter;
- All-in sustaining cost per ounce of silver1, net of by-product credits, of $5.61, compared to $5.69 in the prior year quarter;
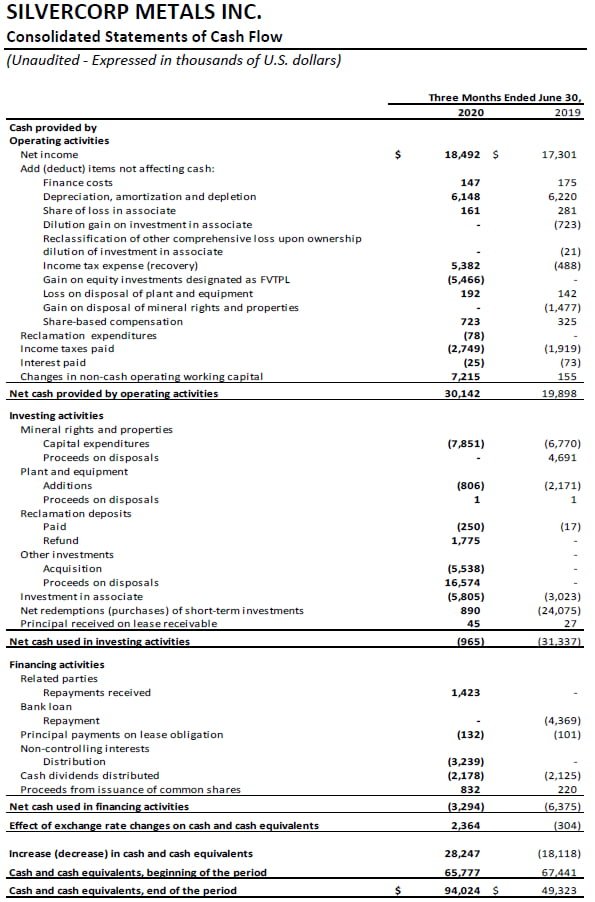
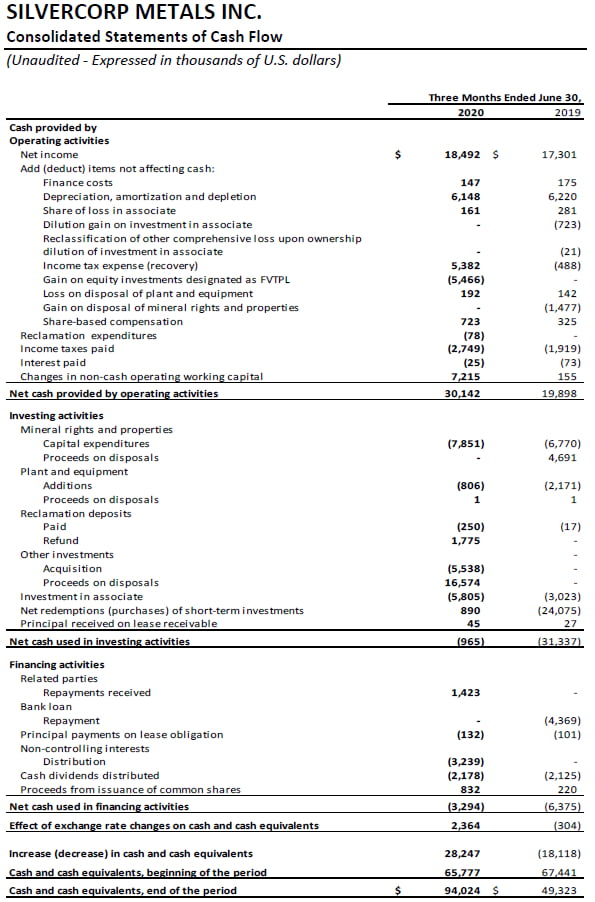
- Cash flow from operations of $30.1 million, compared to $19.9 million in the prior year quarter;
- Gain of $16.4 million on equity investments;
- Receipt of $6.5 million (CAD$9.0 million) break fee from Guyana Goldfields Inc.;
- Paid dividends of $2.2 million, or $0.0125 per share, to equity shareholders;
- Invested $5.8 million in New Pacific Metals Corp. (“NUAG”) to maintain the Company’s ownership interest at 28.8%;
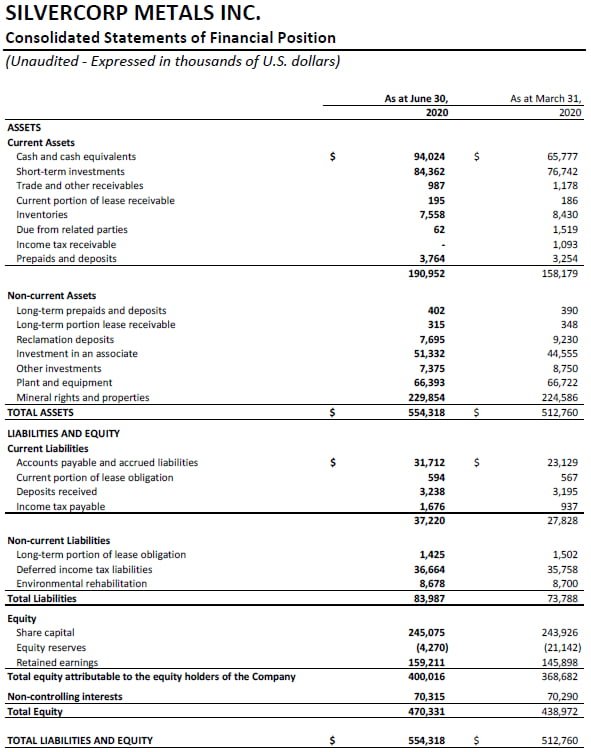
- Strong balance sheet with $178.4 million in cash and cash equivalents and short-term investments, an increase of $35.9 million or 25% compared to March 31, 2020; and,
- Investment in NUAG with market value of $178.2 million and other investments of $7.4 million.
FINANCIALS
Net income attributable to equity shareholders of the Company in Q1 Fiscal 2021 was $15.5 million, or $0.09 per share, compared to $12.6 million, or $0.07 per share in the three months ended June 30, 2019 (“Q1 Fiscal 2020”).
The Company’s financial results in Q1 Fiscal 2021 were mainly impacted by the following: i) an increase of 1%, 10% and 17% in the amount of silver, gold, and lead sold, respectively; offset by a 5% decrease in the amount of zinc sold; ii) an increase of 10% and 24% in the net realized selling prices for silver and gold, offset by a decrease of 19% and 14% in the net realized selling prices for lead and zinc; iii) gain of $16.4 million on equity investments, of which $5.5 million was reported in profit and $10.9 million was reported in other comprehensive income; offset by a $1.8 million increase in foreign exchange loss; and iv) a $5.9 million increase in income tax expenses.
Revenue in Q1 Fiscal 2021 was $46.7 million, up 2% or $1.1 million compared to $45.6 million in the prior year quarter. The increase was mainly due to i) an increase of $2.4 million in revenue arising from the increase in the amount of silver, gold and lead sold; ii) an increase of $2.7 million in revenue arising from the increase in net realized selling prices for silver and gold; offset by iii) a decrease of $3.6 million in revenue arising from the decrease in net realized selling price for lead and zinc; and iv) a decrease of $0.2 million in revenue due to less zinc sold. Silver, gold and base metal sales represented $26.2 million, $1.5 million, and $19.0 million, respectively, compared to silver, gold and base metals sales of $23.6 million, $1.1 million, and $20.9 million, respectively, in the prior year quarter. Revenue from the Ying Mining District in Q1 Fiscal 2021 was $39.7 million, up 5% compared to $37.8 million in the prior year quarter. Revenue from the GC Mine in Q1 Fiscal 2021 was $7.0 million, down 10% compared to $7.8 million in the prior year quarter.
Production costs expensed in Q1 Fiscal 2021 were $17.7 million, a slight decrease compared to $18.0 million in Q1 Fiscal 2020. The production costs expensed represent approximately 264,680 tonnes of ore processed and expensed at a cost of $67.05 per tonne, compared to approximately 261,440 tonnes at $68.85 per tonne in Q1 Fiscal 2020.
Mineral resource taxes in Q1 Fiscal 2021 were $1.34 million, up 7% compared to $1.25 million in Q1 Fiscal 2020, and the increase was mainly due to higher revenue.
Government fees and other taxes in Q1 Fiscal 2021 were $0.5 million, compared to $0.6 million in Q1 Fiscal 2020. Government fees and other taxes are comprised of environmental protection fees, surtaxes on VAT, land usage levies, stamp duties and other miscellaneous levies, duties and taxes imposed by the state and local Chinese governments.
Income from mine operations in Q1 Fiscal 2021 was $19.3 million, or 41% of revenue, compared to $17.7 million or 39% of revenue in Q1 Fiscal 2020. Income from mine operations at the Ying Mining District was $17.6 million or 44% of revenue, compared to $16.0 million or 42% of revenue in Q1 Fiscal 2020. Income from mine operations at the GC Mine was $1.8 million or 26% of revenue, compared to $1.8 million or 23% of revenue in Q1 Fiscal 2020.
General and administrative expenses in Q1 Fiscal 2021 were $4.7 million, an increase of $0.2 million compared to $4.5 million in Q1 Fiscal 2020. The increase was mainly due to an increase of $0.4 million in share-based compensation offset by a decrease of $0.2 million in salaries and benefits. General and administrative expenses include corporate administrative expenses of $2.7 million (Q1 Fiscal 2020 – $2.4 million) and mine administrative expenses of $2.1 million (Q1 Fiscal 2020 – $2.1 million).
Foreign exchange loss in Q1 Fiscal 2021 was $2.7 million, an increase of $1.8 million compared to $0.9 million in Q1 Fiscal 2020. The foreign exchange loss is mainly driven by the appreciation of Canadian dollar against US dollar.
Property evaluation and business development expenses in Q1 Fiscal 2021 were a recovery of $3.8 million, compared to an expense of $0.1 million in Q1 Fiscal 2020. On April 26, 2020, the Company entered into a definitive agreement with Guyana Goldfields Inc. (“Guyana Goldfields”), subsequently amended on May 18, 2020 (collectively, the “Arrangement Agreement”) to acquire all of the issued and outstanding shares of Guyana Goldfields. On June 10, 2020, Guyana Goldfield terminated the Arrangement Agreement and paid the Company a break fee of $6.5 million (CAD$9.0 million). Net of expenses of $2.5 million, a gain of $4.0 million on this transaction was recorded as a recovery of property evaluation and business development expenses.
Gain on equity investments recorded in profit in Q1 Fiscal 2021 was $5.5 million, compared to $nil in Q1 Fiscal 2020. A total gain of $16.4 million on equity investments was reported in the current quarter, of which $10.9 million was recorded in other comprehensive income as the Company made elections to account for equity investments on an instrument-by-instrument basis.
Income tax expenses in Q1 Fiscal 2021 was $5.4 million, an increase of $5.9 million, compared to an income tax recovery of $0.5 million in Q1 Fiscal 2020. In Q1 Fiscal 2021, the Company recorded current income tax expenses of $4.6 million (Q1 Fiscal 2020 – $1.8 million), and deferred income tax expenses of $0.8 million (Q1 Fiscal 2020 – deferred income tax recovery of $2.2 million). The current income tax expenses in Q1 Fiscal 2020 included withholding tax expenses of $1.1 million, which was paid at a rate of 10% on dividends distributed out of China. The deferred income tax recovery in Q1 Fiscal 2020 was mainly related to the tax benefit recognized arising from the disposal of the XHP Project.
Cash flow provided by operating activities in Q1 Fiscal 2021 was $30.1 million, up $10.2 million or 51%, compared to $19.9 million in Q1 Fiscal 2020.
The Company ended the quarter with $178.4 million in cash, cash equivalents and short-term investments, an increase of $35.9 million or 25%, compared to $142.5 million as at March 31, 2020.
Working capital as at June 30, 2020 was $153.7 million, an increase of $23.4 million or 18%, compared to $130.4 million as at March 31, 2020.
OPERATIONS AND DEVELOPMENT
In Q1 Fiscal 2021, on a consolidated basis, the Company mined 254,555 tonnes of ore, a slight decrease of 1% or 2,837 tonnes compared to 257,392 tonnes in Q1 Fiscal 2020. Ore milled was 262,326 tonnes, a slight increase of 1% or 2,784 tonnes, compared to 259,542 tonnes in Q1 Fiscal 2020.
The Company sold approximately 1.9 million ounces of silver, 1,100 ounces of gold, 20.9 million pounds of lead, and 7.0 million pounds of zinc, compared to 1.9 million ounces of silver, 1,000 ounces of gold, 17.8 million pounds of lead, and 7.3 million pounds of zinc in Q1 Fiscal 2020.
In Q1 Fiscal 2021, the consolidated total mining and cash mining costs were $73.91 and $54.97 per tonne, down 5% and 1% compared to $77.40 and $55.45 per tonne, respectively, in Q1 Fiscal 2020. The decrease in cash mining costs was mainly due to a decrease of $3.70 per tonne in the cash mining costs at the GC mine, offset by an increase of $1.07 per tonne in the cash mining costs at the Ying Mining District.
The consolidated total milling and cash milling costs in Q1 Fiscal 2021 were $11.04 and $9.58 per tonne, down 12% and 10% compared to $12.49 and $10.63 per tonne, respectively, in Q1 Fiscal 2020. The decrease in per tonne cash milling costs was mainly due to a decrease of $0.2 million in labour costs.
Correspondingly, the consolidated cash production cost per tonne of ore processed in Q1 Fiscal 2021 was $67.05, down 3% compared to $68.85 in Q1 Fiscal 2020. The consolidated all-in sustaining production costs per tonne of ore processed was $112.59, down 6% compared to $120.16 in Q1 Fiscal 2020. The decrease was mainly due to the lower per tonne production costs as discussed above and a $1.6 million decrease in sustaining capital expenditures.
In Q1 Fiscal 2021, the consolidated cash cost per ounce of silver, net of by-product credits, was negative $1.48, compared to negative $2.17, in Q1 Fiscal 2020. The increase in cash cost per ounce of silver, net of by-product credits, was mainly due to a decrease of $1.5 million in by-product sales.
In Q1 Fiscal 2021, the consolidated all-in sustaining cost per ounce of silver, net of by-product credits, was $5.61 compared to $5.69 in Q1 Fiscal 2020. The decrease was mainly due to i) a $1.6 million decrease in sustaining capital expenditures, offset by ii) the increase in cash cost per ounce of silver, net of by-product credits as discussed above.
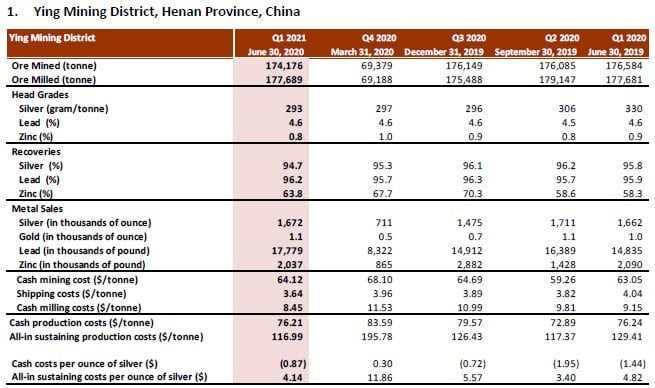
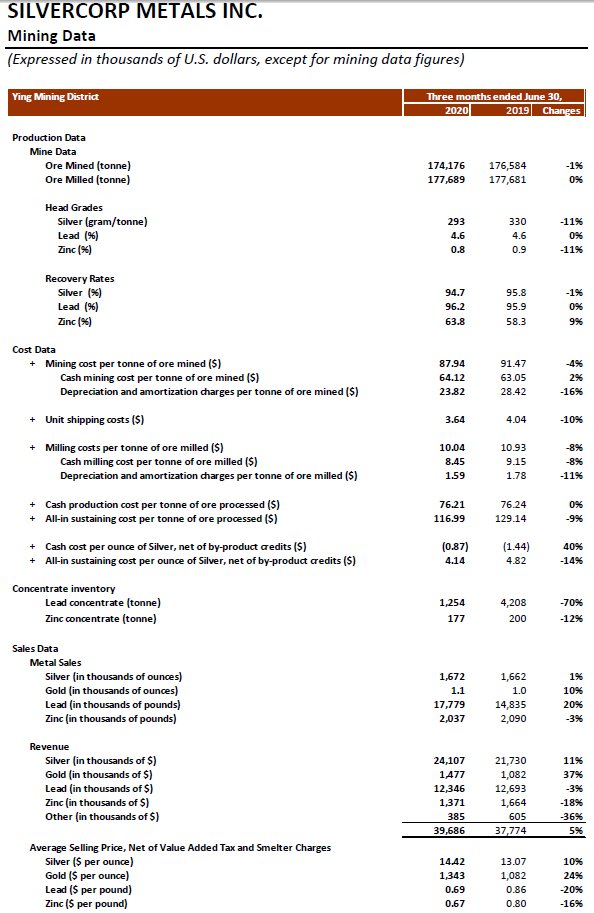
In Q1 Fiscal 2021, the total ore mined at the Ying Mining District was 174,176 tonnes, a slight decrease of 1% or 2,408 tonnes compared to 176,584 tonnes mined in the prior year quarter. Ore milled was 177,689 tonnes, comparable to 177,681 tonnes in Q1 Fiscal 2020.
Head grades were 293 grams per tonne (“g/t”) for silver, 4.6% for lead, and 0.8% for zinc, compared to 330 g/t for silver, 4.6% for lead, and 0.9% for zinc in the prior year quarter. The variation in silver head grade is mainly related to the Company’s planned mining sequence and is in line with Fiscal 2021 Guidance (defined below).
In Q1 Fiscal 2021, the Ying Mining District sold approximately 1.7 million ounces of silver, 17.8 million pounds of lead, and 2.0 million pounds of zinc, compared to 1.7 million ounces of silver, 14.8 million pounds of lead, and 2.1 million pounds of zinc in the prior year quarter.
Total and cash mining costs per tonne at the Ying Mining District in Q1 Fiscal 2021 were $87.94 and $64.12 per tonne, respectively, compared to $91.47 and $63.05 per tonne in the prior year quarter. The increase in the per tonne cash mining cost was mainly due to a 2% increase in mining preparation costs.
Total and cash milling costs per tonne at the Ying Mining District in Q1 Fiscal 2021 were $10.04 and $8.45, respectively, compared to $10.93 and $9.15 in Q1 Fiscal 2020. The decrease in per tonne milling costs was mainly due to a decrease of $0.39 per tonne in labour costs and a decrease of $0.23 per tonne in utility costs.
Correspondingly, the cash production cost per tonne of ore processed in Q1 Fiscal 2021 at the Ying Mining District was $76.21, compared to $76.24 in the prior year quarter. The all-in sustaining production cost per tonne of ore processed was $116.99, down 9% compared to $129.14 in Q1 Fiscal 2020. The decrease was mainly due to a $2.0 million decrease in sustaining capital expenditures.
Cash cost per ounce of silver, net of by-product credits, in Q1 Fiscal 2021 at the Ying Mining District, was negative $0.87 compared to negative $1.44 in the prior year quarter. The increase was mainly due to a $0.5 million decrease in by-product sales resulting from a decrease in the net realized selling prices of lead and zinc.
All-in sustaining cost per ounce of silver, net of by-product credits, in Q1 Fiscal 2021 at the Ying Mining District was $4.14 compared to $4.82 in Q1 Fiscal 2020. The decrease was mainly due to a $2.0 million decrease in sustaining capital expenditures.
In Q1 Fiscal 2021, approximately 28,485 metres or $0.8 million worth of diamond drilling (Q1 Fiscal 2020 – 23,648 metres or $0.6 million) and 6,207 metres or $1.8 million worth of preparation tunnelling (Q1 Fiscal 2020 – 6,395 metres or $1.7 million) were completed and expensed as mining preparation costs at the Ying Mining District. In addition, approximately 23,108 metres or $7.8 million worth of horizontal tunnels, raises, ramps and declines (Q1 Fiscal 2020 – 20,895 metres or $7.1 million) were completed and capitalized.
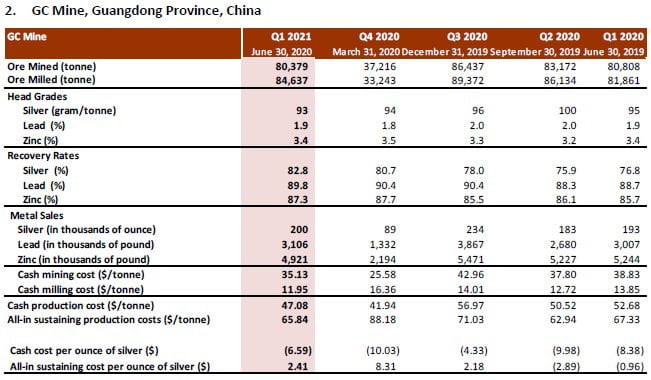
In Q1 Fiscal 2021, the total ore mined at the GC Mine was 80,379 tonnes, a slight decrease compared to 80,808 tonnes in Q1 Fiscal 2020. Ore milled was 84,637 tonnes, an increase of 3% or 2,776 tonnes compared to 81,861 tonnes in Q1 Fiscal 2020.
Average head grades of ore processed at the GC Mine were 93 g/t for silver, 1.9% for lead, and 3.4% for zinc, compared to 95 g/t for silver, 1.9% for lead, and 3.4% for zinc in Q1 Fiscal 2020. Recovery rates of ore processed were 82.8% for silver, 89.8% for lead, and 87.3% for zinc, compared to 76.8% for silver, 88.7% for lead, and 85.7% for zinc in Q1 Fiscal 2020.
In Q1 Fiscal 2021, GC Mine sold approximately 200,000 ounces of silver, 3.1 million pounds of lead, and 4.9 million pounds of zinc, compared to 193,000 ounces of silver, 3.0 million pounds of lead, and 5.2 million pounds of zinc in Q1 Fiscal 2020.
Total and cash mining costs per tonne at the GC Mine in Q1 Fiscal 2021 were $43.50 and $35.13 per tonne, a decrease of 7% and 10%, respectively, compared to $46.64 and $38.83 per tonne, respectively, in Q1 Fiscal 2020. The decrease in the cash mining cost was mainly due to a $0.7 million decrease in mining preparation costs. Total and cash milling cost per tonne at the GC Mine in Q1 Fiscal 2021 were $13.14 and $11.95, a decrease of 17% and 14%, respectively, compared to $15.88 and $13.85, respectively, in Q1 Fiscal 2020. The decrease in cash milling costs was mainly due to a $0.1 million decrease in labour costs.
Correspondingly, the cash production cost per tonne of ore processed in Q1 Fiscal 2021 at the GC Mine was $47.08, a decrease of 11% compared to $52.68 in Q1 Fiscal 2020. The all-in sustaining production costs per tonne of ore processed was $65.84, down 2% compared to $67.33 in Q1 Fiscal 2020.
Cash cost per ounce of silver, net of by-product credits, at the GC Mine, was negative $6.59 compared to negative $8.38 in Q1 Fiscal 2020. The increase was mainly due to a $1.0 million decrease in by-product sales resulting from a decrease in the net realized selling prices of lead and zinc.
All-in sustaining cost per ounce of silver, net of by-product credits, in Q1 Fiscal 2021 at the GC Mine was $2.41 compared to negative $0.96 in Q1 Fiscal 2020. The increase was mainly due to i) the increase in cash cost per ounce of silver, net of by-product credits, as discussed above, and ii) a $0.3 million increase in sustaining capital expenditures.
In Q1 Fiscal 2021, approximately 8,212 metres or $0.3 million worth of underground diamond drilling (Q1 Fiscal 2020 – 7,970 metres or $0.3 million) and 3,458 metres or $0.8 million worth of tunnelling (Q1 Fiscal 2020 – 6,261 metres or $1.4 million) were completed and expensed as mining preparation costs at the GC Mine. In addition, approximately 3,267 metres or $1.2 million worth of horizontal tunnels, raises, ramps and declines (Q1 Fiscal 2020 – 497 metres or $0.3 million) were completed and capitalized.
3. Annual Operating Outlook
All references to Fiscal 2021 Guidance in this news release refers to the “Fiscal 2021 Production, Cash Cost Guidance” section in the Company’s Fiscal 2020 Annual MD&A dated May 20, 2020 (“Fiscal 2021 Guidance”) filed under the Company’s profile at www.sedar.com.
(i) Production and Production Costs
The following table summarizes the Q1 Fiscal 2021 production and production costs achieved compared to the respective Fiscal 2021 Guidance:
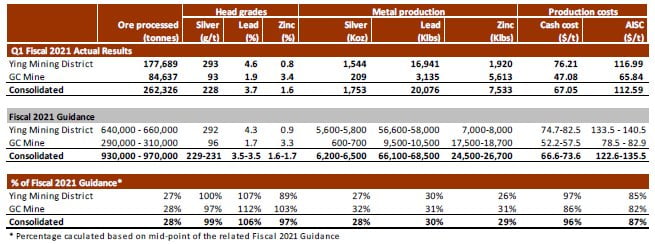
Based on year-to-date production, production costs and the expected production for the remainder of the year, the Company reaffirms its Fiscal 2021 Guidance.
(ii) Development and Capital Expenditures
The following table summarizes the Q1 Fiscal 2021 development work and capitalized expenditures compared to the respective Fiscal 2021 Guidance.
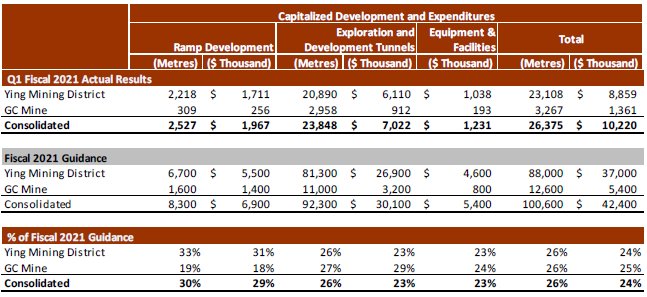
Based on year-to-date capital expenditures and the expected capital expenditures for the remainder of the year (save for the capital expenditures to be incurred to build an aggregate plant as described below, which was not included in the Company’s Fiscal 2021 Guidance), the Company reaffirms the Fiscal 2021 Guidance.
The Company is investing approximately $2.9 million (approximately RMB¥20.0 million) to construct a 1,000,000 tonnes per year aggregate plant to crush and recycle the waste rock from the Ying Mining District with the goal of supplying the resulting products to the local construction market. The plant is expected to be commissioned in October 2020, and its profits, after capital recovery, will be shared between the local government, the local communities, and employees. This investment demonstrates our ongoing commitment and efforts to minimize our operations’ impacts on the environment and our commitment to create a sustainable contribution to the communities where our people work and live.
(iii) Ongoing Exploration Programs
The Company is currently undertaking extensive drill programs at the Ying and GC Mines with two main objectives: i) areas with existing development and access are being re-examined to define more resources and reserves, which may lead to a substantial reduction in mining and sustaining capital costs associated with the tonnes identified, and ii) areas which may have been overlooked for potential gold mineralization are being tested for different alteration styles from the typical silver-lead zones.
Mr. Guoliang Ma, P.Geo., Manager of Exploration and Resources of the Company, is the Qualified Person as defined by National Instrument 43-101 – Standards of Disclosure for Mineral Projects and has reviewed and given consent to the technical information contained in this news release.
This earnings release should be read in conjunction with the Company’s Management Discussion & Analysis, Financial Statements and Notes to Financial Statements for the corresponding period, which have been posted on SEDAR under the Company’s profile at www.sedar.com and are also available on the Company’s website at www.silvercorp.ca.
About Silvercorp
Silvercorp is a profitable Canadian mining company producing silver, lead and zinc metals in concentrates from mines in China. The Company’s goal is to continuously create healthy returns to shareholders through efficient management, organic growth and the acquisition of profitable projects. Silvercorp balances profitability, social and environmental relationships, employees’ wellbeing, and sustainable development. For more information, please visit our website at www.silvercorp.ca.
For further information
Silvercorp Metals Inc.
Lon Shaver
Vice President
Phone: (604) 669-9397
Toll Free: 1(888) 224-1881
Email: investor@silvercorp.ca
Website: www.silvercorp.ca
CAUTIONARY DISCLAIMER – FORWARD-LOOKING STATEMENTS
Certain of the statements and information in this news release constitute “forward-looking statements” within the meaning of the United States Private Securities Litigation Reform Act of 1995 and “forward-looking information” within the meaning of applicable Canadian provincial securities laws (collectively, “forward-looking statements”). Any statements or information that express or involve discussions with respect to predictions, expectations, beliefs, plans, projections, objectives, assumptions or future events or performance (often, but not always, using words or phrases such as “expects”, “is expected”, “anticipates”, “believes”, “plans”, “projects”, “estimates”, “assumes”, “intends”, “strategies”, “targets”, “goals”, “forecasts”, “objectives”, “budgets”, “schedules”, “potential” or variations thereof or stating that certain actions, events or results “may”, “could”, “would”, “might” or “will” be taken, occur or be achieved, or the negative of any of these terms and similar expressions) are not statements of historical fact and may be forward-looking statements. Forward-looking statements relate to, among other things: the price of silver and other metals; the accuracy of mineral resource and mineral reserve estimates at the Company’s material properties; the sufficiency of the Company’s capital to finance the Company’s operations; estimates of the Company’s revenues and capital expenditures; estimated production from the Company’s mines in the Ying Mining District and the GC Mine; timing of receipt of permits and regulatory approvals; availability of funds from production to finance the Company’s operations; and access to and availability of funding for future construction, use of proceeds from any financing and development of the Company’s properties.
Forward-looking statements are subject to a variety of known and unknown risks, uncertainties and other factors that could cause actual events or results to differ from those reflected in the forward-looking statements, including, without limitation, risks relating to: global economic and social impact of COVID-19; fluctuating commodity prices; calculation of resources, reserves and mineralization and precious and base metal recovery; interpretations and assumptions of mineral resource and mineral reserve estimates; exploration and development programs; feasibility and engineering reports; permits and licences; title to properties; property interests; joint venture partners; acquisition of commercially mineable mineral rights; financing; recent market events and conditions; economic factors affecting the Company; timing, estimated amount, capital and operating expenditures and economic returns of future production; integration of future acquisitions into the Company’s existing operations; competition; operations and political conditions; regulatory environment in China and Canada; environmental risks; foreign exchange rate fluctuations; insurance; risks and hazards of mining operations; key personnel; conflicts of interest; dependence on management; internal control over financial reporting; and bringing actions and enforcing judgments under U.S. securities laws.
This list is not exhaustive of the factors that may affect any of the Company’s forward-looking statements. Forward-looking statements are statements about the future and are inherently uncertain, and actual achievements of the Company or other future events or conditions may differ materially from those reflected in the forward-looking statements due to a variety of risks, uncertainties and other factors, including, without limitation, those referred to in the Company’s Annual Information Form under the heading “Risk Factors”. Although the Company has attempted to identify important factors that could cause actual results to differ materially, there may be other factors that cause results not to be as anticipated, estimated, described or intended. Accordingly, readers should not place undue reliance on forward-looking statements.
The Company’s forward-looking statements are based on the assumptions, beliefs, expectations and opinions of management as of the date of this news release, and other than as required by applicable securities laws, the Company does not assume any obligation to update forward-looking statements if circumstances or management’s assumptions, beliefs, expectations or opinions should change, or changes in any other events affecting such statements. For the reasons set forth above, investors should not place undue reliance on forward-looking statements.