VANCOUVER, British Columbia – November 5, 2020 – Silvercorp Metals Inc. (“Silvercorp” or the “Company”) (TSX/NYSE American: SVM) reported its financial and operating results for the second quarter ended September 30, 2020 (“Q2 Fiscal 2021”). All amounts are expressed in US Dollars.
Q2 FISCAL YEAR 2021 HIGHLIGHTS
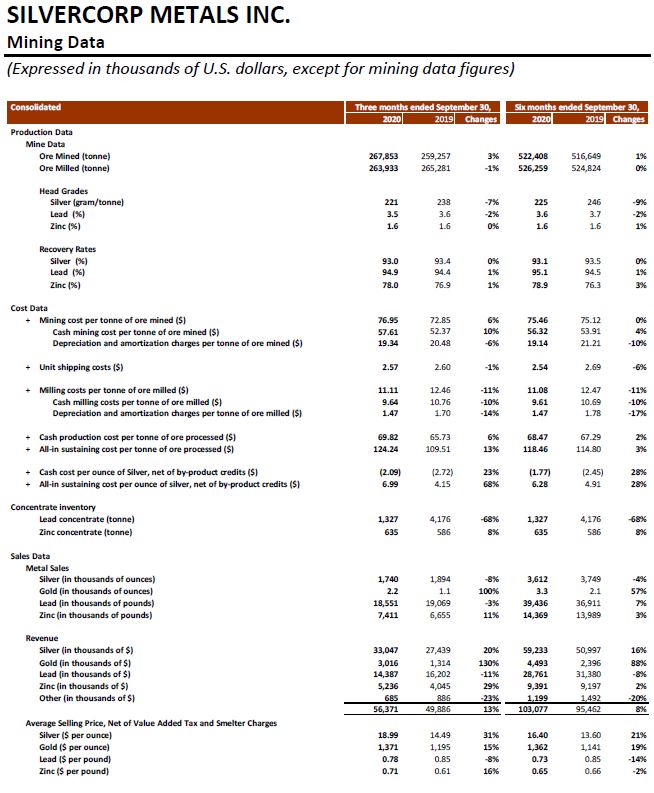
- Mined 267,853 tonnes of ore, up 3% compared to the prior year quarter;
- Sold approximately 1.7 million ounces of silver, 2,200 ounces of gold, 18.6 million pounds of lead, and 7.4 million pounds of zinc, representing an increase of 100% and 11% in gold and zinc sold, and a decrease of 8% and 3% in silver and lead sold, compared to the prior year quarter;
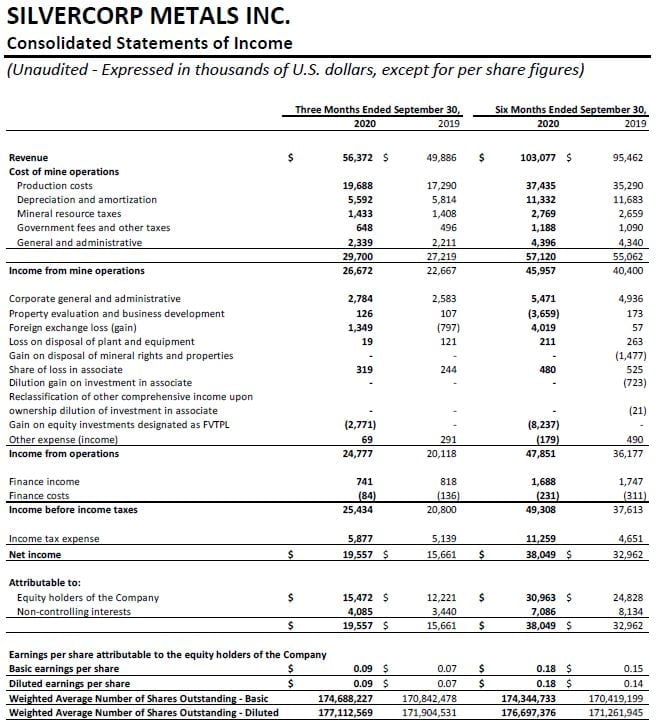
- Revenue of $56.4 million, up 13% or $6.5 million compared to $49.9 million in the prior year quarter;
- Net income attributable to equity shareholders of the Company of $15.5 million, or $0.09 per share, up 27% compared to $12.2 million or $0.07 per share in the prior year quarter;
- Cash cost per ounce of silver1, net of by-product credits, of negative $2.09, compared to negative $2.72 in the prior year quarter;
- All-in sustaining cost per ounce of silver1, net of by-product credits, of $6.99, compared to $4.15 in the prior year quarter;
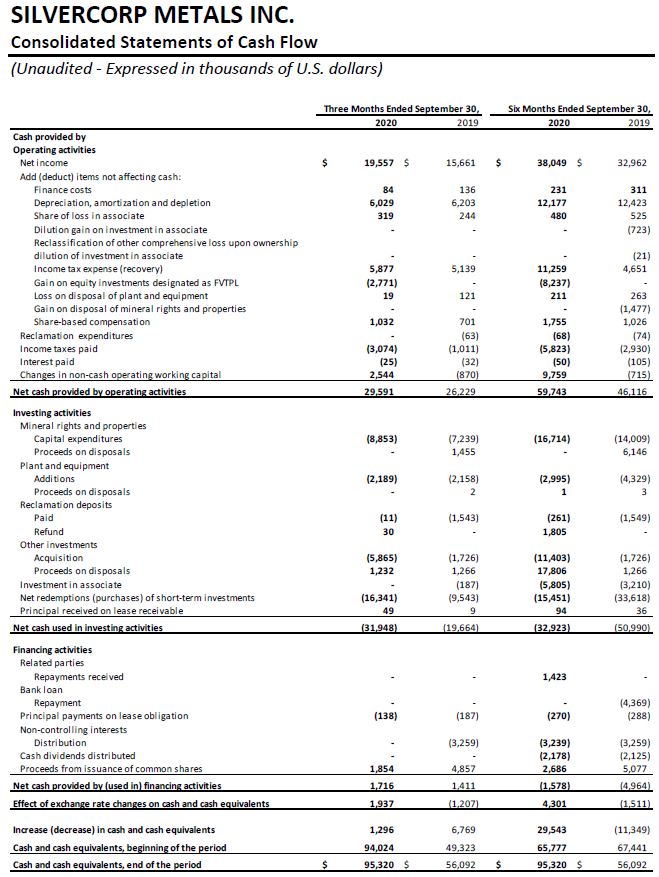
- Cash flow from operations of $29.6 million, up 13% compared to $26.2 million in the prior year quarter;
- Gain of $2.8 million on equity investments;
- Invested $5.6 million in two Canadian junior exploration companies;
- Investment in New Pacific Metals Corp. (“NUAG”) with market value of $212.0 million and other investments of $16.4 million; and
- Strong balance sheet with $200.1 million in cash and cash equivalents and short-term investments, an increase of $21.7 million or 12% compared to $178.4 million as at June 30, 2020.
FINANCIALS
Net income attributable to equity shareholders of the Company in Q2 Fiscal 2021 was $15.5 million, or $0.09 per share, compared to $12.2 million, or $0.07 per share in the three months ended September 30, 2019 (“Q2 Fiscal 2020”).
Compared to Q2 Fiscal 2020, the Company’s financial results in Q2 Fiscal 2021 were mainly impacted by the following: i) an increase of 31%, 15% and 16% in the net realized selling prices for silver, gold and zinc, offset by a decrease of 8% in the net realized selling price for lead; ii) an increase of 100% and 11% in the amount of gold and zinc sold, offset by a decrease of 8% and 3% in the amount of silver and lead sold; iii) a gain of $2.8 million on equity investments reported in profit; and offset by iv) $1.3 million in foreign exchange loss.
Revenue in Q2 Fiscal 2021 was $56.4 million, up 13% or $6.5 million compared to $49.9 million in Q2 Fiscal 2020. The increase was mainly due to i) an increase of $9.4 million in revenue arising from the increase in the net realized selling prices for silver, gold and lead; and ii) an increase of $2.0 million in revenue arising from the increase in the amount of gold and zinc sold; offset by iii) a decrease of $1.4 million arising from the decrease in the net realized selling price for lead; iv) a decrease of $3.3 million arsing from the decrease in the amount of silver and lead sold; and v) a decrease of $0.2 million in revenue from other metals. Silver, gold and base metal sales represented $33.0 million, $3.0 million, and $20.3 million, respectively, compared to silver, gold and base metals sales of $27.4 million, $1.3 million, and $21.1 million, respectively, in Q2 Fiscal 2020. Revenue from the Ying Mining District in Q2 Fiscal 2021 was $45.7 million, up 8% compared to $42.3 million in Q2 Fiscal 2020. Revenue from the GC Mine in Q2 Fiscal 2021 was $9.2 million, up 21% compared to $7.6 million in Q2 Fiscal 2020. Revenue from the BYP Mine was $1.5 million, compared to $nil in Q2 Fiscal 2020 as the Company sold all remaining gold concentrate inventories produced by the mine before it was placed on care and maintenance in 2014.
Production costs expensed in Q2 Fiscal 2021 were $19.7 million, an increase of $2.4 million, compared to $17.3 million in Q2 Fiscal 2020. The production costs expensed represent approximately 281,980 tonnes of ore processed and expensed at a cost of $69.82 per tonne, compared to approximately 263,050 tonnes at $65.73 per tonne in Q2 Fiscal 2020.
Income from mine operations in Q2 Fiscal 2021 was $26.7 million or 47% of revenue, compared to $22.7 million or 45% of revenue in Q2 Fiscal 2020. Income from mine operations at the Ying Mining District was $23.1 million or 51% of revenue, compared to $20.5 million or 49% of revenue in Q2 Fiscal 2020. Income from mine operations at the GC Mine was $2.9 million or 32% of revenue, compared to $2.2 million or 29% of revenue in Q2 Fiscal 2020.
General and administrative expenses in Q2 Fiscal 2021 were $5.1 million, an increase of $0.3 million compared to $4.8 million in Q2 Fiscal 2020. The increase was mainly due to an increase of $0.3 million in share-based compensation. General and administrative expenses included corporate administrative expenses of $2.8 million (Q2 Fiscal 2020 – $2.6 million) and mine administrative expenses of $2.3 million (Q2 Fiscal 2020 – $2.2 million).
Foreign exchange loss in Q2 Fiscal 2021 was $1.3 million compared to a gain of $0.8 million in Q2 Fiscal 2020. The foreign exchange loss is mainly driven by the appreciation of the Canadian dollar against the US dollar.
Share of loss in an associate in Q2 Fiscal 2021 was $0.3 million (Q2 Fiscal 2020 – $0.2 million), representing the Company’s equity share of the loss in NUAG.
Gain on equity investments recorded in profit in Q2 Fiscal 2021 was $2.8 million, compared to $nil in Q2 Fiscal 2020. A total gain of $4.8 million on equity investments was reported in Q2 Fiscal 2021, of which $2.0 million was recorded in other comprehensive income as the Company made elections to account for equity investments on an instrument-by-instrument basis.
Income tax expenses in Q2 Fiscal 2021 were $5.9 million, compared to $5.1 million in Q2 Fiscal 2020. The income tax expenses comprised of current income tax expenses of $5.2 million (Q2 Fiscal 2020 – $1.0 million) and deferred income tax expenses of $0.7 million (Q2 Fiscal 2020 – $4.2 million).
Cash flow provided by operating activities in Q2 Fiscal 2021 was $29.6 million, an increase of $3.4 million, compared to $26.2 million in Q2 Fiscal 2020.
For the six months ended September 30, 2020, net income attributable to equity shareholders of the Company was $31.0 million or $0.18 per share, an increase of $6.2 million, compared to $24.8 million or $0.14 per share in the same prior year period; revenue was $103.1 million, up 8% or $7.6 million, compared to $95.5 million in the same prior year period; income from mine operations was $46.0 million or 45% of revenue, compared to $40.4 million or 42% of revenue in the same prior year period; gain on equity recorded in profit was $8.2 million compared to $nil in the same prior year period; foreign exchange loss was $4.0 million compared to $0.1 million in the same prior year period; and cash flow from operating activities was $59.7 million, up 30% from $46.1 million in the same prior year period.
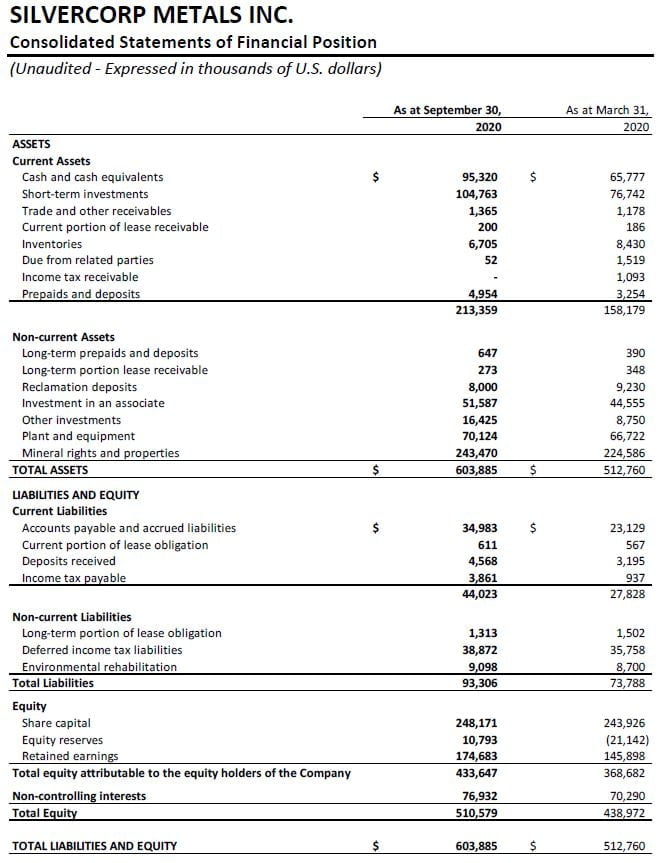
The Company ended the period with $200.1 million in cash and short-term investments, an increase of $21.7 million or 12% compared to $178.4 million as at June 30, 2020; and an increase of $57.6 million or 40% compared to $142.5 million as at March 31, 2020.
Working capital as at September 30, 2020 was $169.3 million, an increase of $15.6 million or 10% compared to $153.7 million as at June 30, 2020; and an increase of $39.0 million or 30%, compared to $130.4 million as at March 31, 2020.
OPERATIONS AND DEVELOPMENT
(i) Q2 Fiscal 2021 vs. Q2 Fiscal 2020
In Q2 Fiscal 2021, on a consolidated basis, the Company mined 267,853 tonnes of ore, up 3% or 8,596 tonnes compared to 259,257 tonnes in Q2 Fiscal 2020. Ore milled was 263,933 tonnes, a slight decrease of 1% or 1,348 tonnes, compared to 265,281 tonnes in Q2 Fiscal 2020.
In Q2 Fiscal 2021, the Company sold approximately 1.7 million ounces of silver, 2,200 ounces of gold, 18.6 million pounds of lead, and 7.4 million pounds of zinc, an increase of 100% and 11% in gold and zinc sold, and a decrease of 8% and 3% in silver and lead sold, compared to 1.9 million ounces of silver, 1,100 ounces of gold, 19.1 million pounds of lead, and 6.7 million pounds of zinc in Q2 Fiscal 2020.
In Q2 Fiscal 2021, the consolidated total mining and cash mining costs were $76.95 and $57.61 per tonne, up 6% and 10% compared to $72.85 and $52.37 per tonne, respectively, in Q2 Fiscal 2020. The increase in per tonne cash mining costs was mainly due to an increase of $1.4 million in drilling and related expenses arising from an increase of 38,326 metres of diamond drilling.
The consolidated total milling and cash milling costs were $11.11 and $9.64 per tonne, down 11% and 10% compared to $12.46 and $10.76 per tonne, respectively, in Q2 Fiscal 2020. The decrease in per tonne cash milling costs was mainly due to a decrease of $0.2 million in raw material costs.
Correspondingly, the consolidated cash production cost per tonne of ore processed in Q2 Fiscal 2021 was $69.82, up 6% compared to $65.73 in Q2 Fiscal 2020. The consolidated all-in sustaining production cost per tonne of ore processed was $124.24, up 13% compared to $109.51 in Q2 Fiscal 2020, but within the Company’s annual cost guidance. The increase was mainly due to the increase in cash mining costs and a $2.3 million increase in sustaining capital expenditures.
In Q2 Fiscal 2021, the consolidated cash cost per ounce of silver, net of by-product credits, was negative $2.09, compared to negative $2.72, in Q2 Fiscal 2020. The consolidated all-in sustaining cost per ounce of silver, net of by-product credits, was $6.99 compared to $4.15 in Q2 Fiscal 2020. The increase was mainly due to i) an increase of 6% in per tonne production costs; ii) a decrease of $0.9 million in by-product sales; iii) a decrease of 8% in silver sold, and iv) an increase of $2.3 million in sustaining capital expenditures.
In Q2 Fiscal 2021, on a consolidated basis, approximately 71,274 metres or $2.5 million worth of diamond drilling (Q2 Fiscal 2020 – 32,948 metres or $1.1 million) and 7,693 metres or $1.9 million worth of preparation tunnelling (Q2 Fiscal 2020 – 11,656 metres or $3.1 million) were completed and expensed as mining preparation costs. In addition, approximately 25,678 metres or $8.5 million worth of horizontal tunnels, raises, ramps and declines (Q2 Fiscal 2020 – 20,107 metres or $7.1 million) were completed and capitalized.
(ii) Six months ended September 30, 2020 vs. six months ended September 30, 2019
For the six months ended September 30, 2020, on a consolidated basis, the Company mined 522,408 tonnes of ore, up 1% or 5,759 tonnes, compared to 516,649 tonnes mined in the same prior year period. Ore milled was 526,259 tonnes, a slight increase of 1,435 tonnes, compared to 524,824 tonnes in the same prior year period.
The Company sold approximately 3.6 million ounces of silver, 3,300 ounces of gold, 39.4 million pounds of lead, and 14.4 million pounds of zinc, an increase of 57%, 7%, and 3% in gold, lead, and zinc sold, and a decrease of 4% in silver sold, compared to 3.7 million ounces of silver, 2,100 ounces of gold, 36.9 million pounds of lead, and 14.0 million pounds of zinc sold in the same prior year period.
For the six months ended September 30, 2020, the consolidated total mining cost and cash mining cost were $75.46 and $56.32 per tonne, respectively, compared to $75.12 and $53.91 per tonne in the same prior year period. The increase in per tonne cash mining cost was mainly due to an increase of $2.5 million in drilling and related expenses arising from an increase of 43,405 metres of diamond drilling.
The consolidated total milling cost and cash milling cost were $11.08 and $9.61, respectively, compared to $12.47 and $10.69 per tonne in the same prior year period.
Correspondingly, the consolidated cash production cost per tonne of ore processed was $68.47, up 2% compared to $67.29 in the same prior year period. The all-in sustaining production cost per tonne of ore processed was $118.46, up 3% compared to $114.80 in the same prior year period. The increase was mainly due to the increase in per tonne cash mining costs and an increase of $0.7 million in sustaining capital expenditures.
For the six months ended September 30, 2020, the consolidated cash cost per ounce of silver, net of by-product credits, was negative $1.77, compared to negative $2.45 in the same prior year period. The consolidated all-in sustaining cost per ounce of silver, net of by-product credits was $6.28 compared to $4.91 in the same prior year period. The increase was mainly due to i) an increase of 2% in per tonne production costs; ii) a decrease of $0.6 million in by-product sales; iii) an increase of $0.7 million in sustaining capital expenditures; and iv) a decrease of 4% in silver sold.
For the six months ended September 30, 2020, on a consolidated basis, approximately 107,971 metres or $4.5 million worth of diamond drilling (same prior year period – 64,566 metres or $2.0 million) and 17,358 metres or $3.6 million worth of preparation tunnelling (same prior year period – 24,312 metres or $6.2 million) were completed and expensed as mining preparation costs. In addition, approximately 52,053 metres or $17.5 million worth of horizontal tunnels, raises, ramps and declines (same prior year period – 41,499 metres or $14.5 million) were completed and capitalized.
1. Ying Mining District, Henan Province, China
(i) Q2 Fiscal 2021 vs. Q2 Fiscal 2020
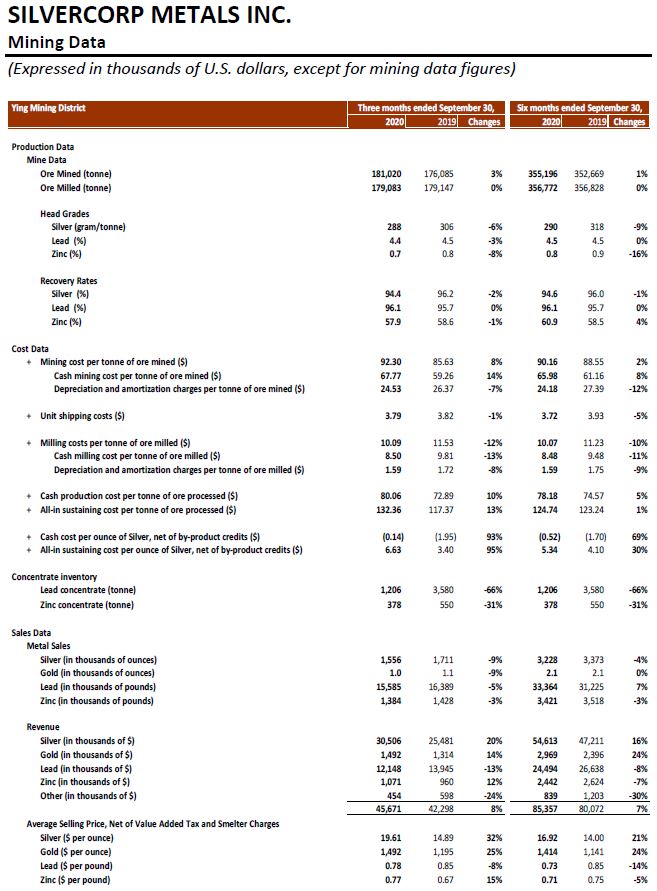
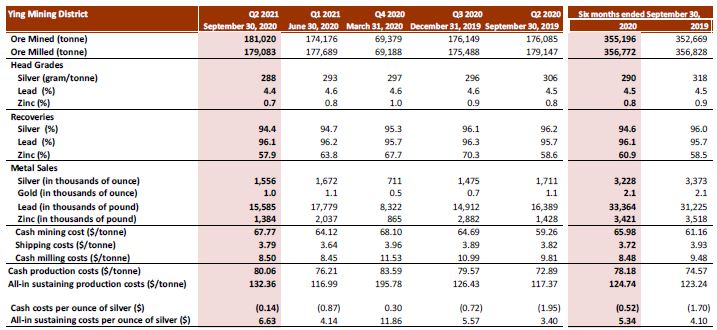
In Q2 Fiscal 2021, the total ore mined at the Ying Mining District was 181,020 tonnes, up 3% or 4,935 tonnes compared to 176,085 tonnes mined in Q2 Fiscal 2020. Ore milled was 179,083 tonnes, a slight decrease compared to 179,147 tonnes in Q2 Fiscal 2020.
Head grades were 288 grams per tonne (“g/t”) for silver, 4.4% for lead, and 0.7% for zinc, compared to 306 g/t for silver, 4.5% for lead, and 0.8% for zinc in Q2 Fiscal 2020.
In Q2 Fiscal 2021, the Ying Mining District sold approximately 1.6 million ounces of silver, 1,000 ounces of gold, 15.6 million pounds of lead, and 1.4 million pounds of zinc, compared to 1.7 million ounces of silver, 1,100 ounces of gold, 16.4 million pounds of lead, and 1.4 million pounds of zinc in Q2 Fiscal 2020.
Total and cash mining costs per tonne at the Ying Mining District in Q2 Fiscal 2021 were $92.30 and $67.77 per tonne, respectively, compared to $85.63 and $59.26 per tonne in Q2 Fiscal 2020. The increase in the per tonne cash mining cost was mainly due to an increase of $1.2 million in drilling and related expenses arising from an increase of 32,533 metres of diamond drilling.
Total and cash milling costs per tonne at the Ying Mining District in Q2 Fiscal 2021 were $10.09 and $8.50, respectively, compared to $11.53 and $9.81 in Q2 Fiscal 2020. The decrease in per tonne milling costs was mainly due to a decrease of $0.2 million in raw material costs.
Correspondingly, the cash production cost per tonne of ore processed in Q2 Fiscal 2021 at the Ying Mining District was $80.06, compared to $72.89 in Q2 Fiscal 2020. The all-in sustaining production cost per tonne of ore processed was $132.36, up 13% compared to $117.37 in Q2 Fiscal 2020, but below the Company’s annual cost guidance. The increase was mainly due to the increase in per tonne cash mining costs and a $1.9 million increase in sustaining capital expenditures.
In Q2 Fiscal 2021, cash cost per ounce of silver, net of by-product credits, at the Ying Mining District was negative $0.14 compared to negative $1.95 in Q2 Fiscal 2020. All-in sustaining cost per ounce of silver, net of by-product credits, was $6.63 compared to $3.40 in Q2 Fiscal 2020. The increase was mainly due to i) the increase in per tonne production costs as discussed above; ii) a decrease of $1.7 million in by-product sales; iii) an increase of $1.9 million in sustaining capital expenditures; and iv) a decrease of 9% in silver sold.
In Q2 Fiscal 2021, approximately 59,540 metres or $2.0 million worth of diamond drilling (Q2 Fiscal 2020 – 27,007 metres or $0.8 million) and 5,316 metres or $1.6 million worth of preparation tunnelling (Q2 Fiscal 2020 – 5,554 metres or $1.6 million) were completed and expensed as mining preparation costs at the Ying Mining District. In addition, approximately 21,278 metres or $7.5 million worth of horizontal tunnels, raises, ramps and declines (Q2 Fiscal 2020 – 19,661 metres or $6.7 million) were completed and capitalized.
(ii) Six months ended September 30, 2020 vs. six months ended September 30, 2019
For the six months ended September 30, 2020, a total of 355,196 tonnes of ore were mined at the Ying Mining District, up 1% or 2,527 tonnes compared to 352,669 tonnes in the same prior year period. Ore milled was 356,772 tonnes, comparable to 356,828 tonnes in the same prior year period. Average head grades of ore processed were 290 g/t for silver, 4.5% for lead, and 0.8% for zinc compared to 318 g/t for silver, 4.5% for lead, and 0.9% for zinc, in the same prior year period.
During the same time period, the Ying Mining District sold approximately 3.2 million ounces of silver, 2,100 ounces of gold, 33.4 million pounds of lead, and 3.4 million pounds of zinc, compared to 3.4 million ounces of silver, 2,100 ounces of gold, 31.2 million pounds of lead, and 3.5 million pounds of zinc in the same prior year period.
For the six months ended September 30, 2020, the cash mining cost at the Ying Mining District was $65.98 per tonne, up 8% compared to $61.16 in the same prior year period. The increase was mainly due to an increase of $2.0 million in drilling and related expenses arising from an increase of 37,370 metres of diamond drilling. The cash milling cost was $8.48 per tonne, down 11% compared to $9.48 in the same prior year period.
Correspondingly, the cash production cost per tonne of ore processed was $78.18, up 5% compared to $74.57 in the prior year period. The all-in sustaining cash production costs per tonne of ore processed were $124.74, up 1%, compared to $123.24 in the same prior year period, but below the Company’s annual cost guidance.
For the six months ended September 30, 2020, the cash cost per ounce of silver and all-in sustaining cost per ounce of silver, net of by-product credits, at the Ying Mining District, were negative $0.52 and $5.34 respectively, compared to negative $1.70 and $4.10 in the same prior year period. The increase was mainly due to i) the increase in per tonne production costs; ii) a decrease of $2.1 million in by-product credits; and iii) a decrease of 4% in silver sold.
For the six months ended September 30, 2020, approximately 88,025 metres or $3.4 million worth of underground diamond drilling (same prior year period – 50,655 metres or $1.4 million) and 11,523 metres or $2.8 million worth of preparation tunnelling (same prior year period – 11,949 metres or $3.3 million) were completed and expensed as mining preparation costs at the Ying Mining District. In addition, approximately 44,386 metres or $15.3 million worth of horizontal tunnels, raises, and declines (same prior year period – 40,556 metres or $13.8 million) were completed and capitalized.
2. GC Mine, Guangdong Province, China
(i) Q2 Fiscal 2021 vs. Q2 Fiscal 2020
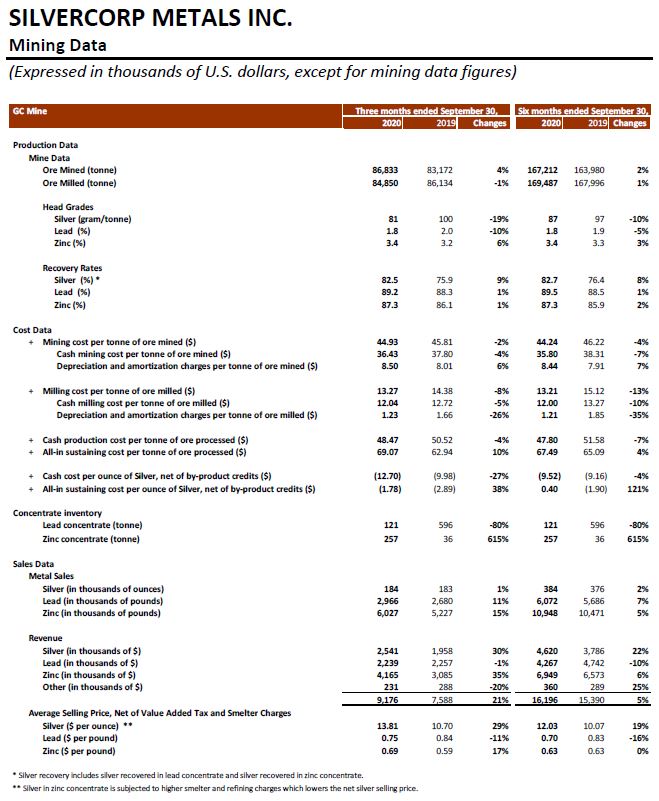
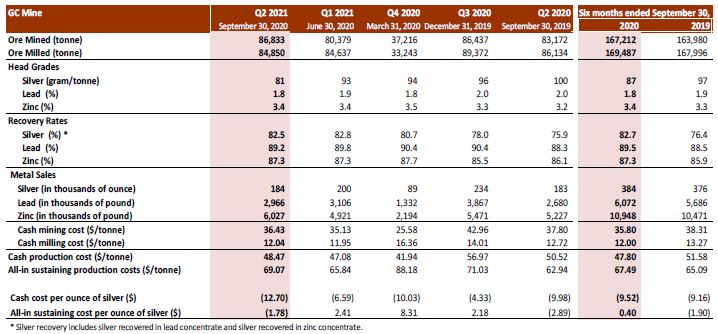
In Q2 Fiscal 2021, the total ore mined at the GC Mine was 86,833 tonnes, up 4% or 3,661 tonnes, compared to 83,172 tonnes in Q2 Fiscal 2020. Ore milled was 84,850 tonnes, a slight decrease of 1% or 1,284 tonnes, compared to 86,134 tonnes in Q2 Fiscal 2020.
Average head grades of ore processed at the GC Mine were 81 g/t for silver, 1.8% for lead, and 3.4% for zinc, compared to 100 g/t for silver, 2.0% for lead, and 3.2% for zinc in Q2 Fiscal 2020. Recovery rates of ore processed were 82.5% for silver, 89.2% for lead, and 87.3% for zinc, compared to 75.9% for silver, 88.3% for lead, and 86.1% for zinc in Q2 Fiscal 2020.
In Q2 Fiscal 2021, GC Mine sold approximately 184 thousand ounces of silver, 3.0 million pounds of lead, and 6.0 million pounds of zinc, compared to 183 thousand ounces of silver, 2.7 million pounds of lead, and 5.2 million pounds of zinc in Q2 Fiscal 2020.
Total and cash mining costs per tonne at the GC Mine in Q2 Fiscal 2021 were $44.93 and $36.43 per tonne, a decrease of 2% and 4%, respectively, compared to $45.81 and $37.80 per tonne in Q2 Fiscal 2020. The decrease in the cash mining cost was mainly due to a $0.3 million decrease in mining preparation costs. Total and cash milling costs per tonne at the GC Mine in Q2 Fiscal 2021 were $13.27 and $12.04, a decrease of 8% and 5%, respectively, compared to $14.38 and $12.72 in Q2 Fiscal 2020.
Correspondingly, the cash production cost per tonne of ore processed at the GC Mine was $48.47, down 4% compared to $50.52 in Q2 Fiscal 2020. The all-in sustaining production cost per tonne of ore processed was $69.07, up 10% compared to $62.94 in Q2 Fiscal 2020. The increase was mainly due to an increase of $0.5 million in sustaining capital expenditures.
In Q2 Fiscal 2021, the cash cost per ounce of silver, net of by-product credits, at the GC Mine, was negative $12.70 compared to negative $9.98 in Q2 Fiscal 2020. The decrease was mainly due to the decrease in per tonne production costs and an increase of $1.0 million in by-product sales.
All-in sustaining cost per ounce of silver, net of by-product credits, at the GC Mine was negative $1.78 compared to negative $2.89 in Q2 Fiscal 2020. The increase was mainly due to an increase of $0.5 million in sustaining capital expenditures offset by the decrease in cash cost per ounce of silver as discussed above.
In Q2 Fiscal 2021, approximately 11,734 metres or $0.5 million worth of underground diamond drilling (Q2 Fiscal 2020 – 5,941 metres or $0.3 million) and 2,377 metres or $0.3 million worth of tunnelling (Q2 Fiscal 2020 – 6,102 metres or $1.5 million) were completed and expensed as mining preparation costs at the GC Mine. In addition, approximately 4,400 metres or $1.0 million worth of horizontal tunnels, raises, ramps and declines (Q2 Fiscal 2020 – 446 metres or $0.4 million) were completed and capitalized.
(ii) Six months ended September 30, 2020 vs. six months ended September 30, 2019
For the six months ended September 30, 2020, a total of 167,212 tonnes of ore were mined and 169,487 tonnes were milled at the GC Mine, an increase of 2% and 1%, respectively, compared to 163,980 tonnes mined and 167,996 tonnes milled in the same prior year period. Average head grades of ore milled were 87 g/t for silver, 1.8% for lead, and 3.4% for zinc compared to 97 g/t for silver, 1.9% for lead, and 3.3% for zinc, in the same prior year period.
During the same time period, the GC Mine sold approximately 384 thousand ounces of silver, 6.1 million pounds of lead, and 10.9 million pounds of zinc, compared to 376 thousand ounces of silver, 5.7 million pounds of lead, and 10.5 million pounds of zinc in the same prior year period.
For the six months ended September 30, 2020, the cash mining costs at the GC Mine was $35.80 per tonne, a decrease of 7% compared to $38.31 per tonne in the same prior year period. The cash milling costs was $12.00 per tonne, a decrease of 10% compared to $13.27 in the same prior year period. Correspondingly, the cash production costs per tonne of ore processed at the GC Mine was $47.80, a decrease of 7% compared to $51.58 in the same prior year period. The all-in sustaining cash production costs per tonne of ore processed was $67.49, an increase of 4% compared to $65.09 in the same prior year period.
For the six months ended September 30, 2020, the cash cost per ounce of silver and all-in sustaining cost per ounce of silver, net of by‐product credits, at the GC Mine, were negative $9.52 and $0.40 respectively, compared to negative $9.16 and negative $1.90 in the same prior year period.
For the six months ended September 30, 2020, approximately 19,946 metres or $1.1 million worth of underground diamond drilling (same prior year period – 13,911 metres or $0.6 million) and 5,835 metres or $0.8 million of tunnelling (same prior year period – 12,363 metres or $2.9 million) were completed and expensed as mining preparation costs at the GC Mine. In addition, approximately 7,667 metres or $2.2 million of horizontal tunnels, raise, and declines (same prior year period – 943 metres or $0.7 million) were completed and capitalized.
OUTLOOK
Based on the year-to-date production levels, production costs, capital expenditures, and the expected production and costs for the remainder of the year, the Company is on track to meet its annual production and cost guidance.
Based on the year-to-date drilling completed, the Company expects its Fiscal 2021 drilling program to exceed its annual guidance. The Company is currently undertaking extensive drill programs at the Ying Mining District and GC Mine with two main objectives: i) areas with existing development and access are being re-examined to potentially define additional resources and reserves, which may lead to a substantial reduction in mining and sustaining capital costs associated with the tonnes identified, and ii) areas which may have been overlooked for potential gold mineralization are being tested for different alteration styles from the typical silver-lead zones.
Scientific and technical information contained in this news release has been reviewed and approved by Mr. Guoliang Ma, P.Geo., Manager of Exploration and Resources of the Company and a Qualified Person as such the term is defined in National Instrument 43-101 – Standards of Disclosure of Mineral Projects.
This earnings release should be read in conjunction with the Company’s MD&A, Financial Statements and Notes to Financial Statements for the corresponding period, which have been posted on SEDAR under the Company’s profile at www.sedar.com and are also available on the Company’s website at www.silvercorp.ca.
About Silvercorp
Silvercorp is a profitable Canadian mining company producing silver, lead and zinc metals in concentrates from mines in China. The Company’s goal is to continuously create healthy returns to shareholders through efficient management, organic growth and the acquisition of profitable projects. Silvercorp balances profitability, social and environmental relationships, employees’ wellbeing, and sustainable development. For more information, please visit our website at www.silvercorp.ca.
For further information
Silvercorp Metals Inc.
Lon Shaver
Vice President
Phone: (604) 669-9397
Toll Free 1(888) 224-1881
Email: investor@silvercorp.ca
Website: www.silvercorp.ca
CAUTIONARY DISCLAIMER – FORWARD-LOOKING STATEMENTS
Certain of the statements and information in this news release constitute “forward-looking statements” within the meaning of the United States Private Securities Litigation Reform Act of 1995 and “forward-looking information” within the meaning of applicable Canadian provincial securities laws (collectively, “forward-looking statements”). Any forward-looking statements that express or involve discussions with respect to predictions, expectations, beliefs, plans, projections, objectives, assumptions or future events or performance (often, but not always, using words or phrases such as “expects”, “is expected”, “anticipates”, “believes”, “plans”, “projects”, “estimates”, “assumes”, “intends”, “strategies”, “targets”, “goals”, “forecasts”, “objectives”, “budgets”, “schedules”, “potential” or variations thereof or stating that certain actions, events or results “may”, “could”, “would”, “might” or “will” be taken, occur or be achieved, or the negative of any of these terms and similar expressions) are not statements of historical fact and may be forward-looking statements. Forward-looking statements relate to, among other things: the price of silver and other metals; the accuracy of mineral resource and mineral reserve estimates at the Company’s material properties; the sufficiency of the Company’s capital to finance the Company’s operations; estimates of the Company’s revenues and capital expenditures; estimated production from the Company’s mines in the Ying Mining District and the GC Mine; projected cash operating costs and all-in sustaining costs, and budgets, on a consolidated and mine-by-mine basis; projections included in the Company’s annual cost guidance; timing of receipt of permits and regulatory approvals; availability of funds from production to finance the Company’s operations; and access to and availability of funding for future construction, use of proceeds from any financing and development of the Company’s properties.
Forward-looking statements are subject to a variety of known and unknown risks, uncertainties and other factors that could cause actual events or results to differ from those reflected in the forward-looking statements, including, without limitation, risks relating to: global economic and social impact of COVID-19; fluctuating commodity prices; calculation of resources, reserves and mineralization and precious and base metal recovery; interpretations and assumptions of mineral resource and mineral reserve estimates; exploration and development programs; feasibility and engineering reports; permits and licences; title to properties; property interests; joint venture partners; acquisition of commercially mineable mineral rights; financing; recent market events and conditions; economic factors affecting the Company; timing, estimated amount, capital and operating expenditures and economic returns of future production; integration of future acquisitions into the Company’s existing operations; competition; operations and political conditions; regulatory environment in China and Canada; environmental risks; foreign exchange rate fluctuations; insurance; risks and hazards of mining operations; key personnel; conflicts of interest; dependence on management; internal control over financial reporting; and bringing actions and enforcing judgments under U.S. securities laws, as well as those risks and uncertainties discussed in the Company’s corresponding MD&A and other public filings of the Company. This list is not exhaustive of the factors that may affect any of the Company’s forward-looking statements.
Forward-looking statements are statements about the future and are inherently uncertain, and actual achievements of the Company or other future events or conditions may differ materially from those expressed or implied in the forward-looking statements.
The Company’s forward-looking statements are necessarily based on a number of estimates, assumptions, beliefs, expectations and opinions of management as of the date of this news release that while considered reasonable by management of the Company, are inherently subject to significant business, economic and competitive uncertainties and contingencies. These estimates, assumptions, beliefs, expectations and opinions include, but are not limited to, those related to the Company’s ability to carry on current and future operations, including: the duration and effects of COVID-19 on our operations and workforce; development and exploration activities; the timing, extent, duration and economic viability of such operations; the accuracy and reliability of estimates, projections, forecasts, studies and assessments; the Company’s ability to meet or achieve estimates, projections and forecasts; the availability and cost of inputs; the price and market for outputs; foreign exchange rates; taxation levels; the timely receipt of necessary approvals or permits; the ability to meet current and future obligations; the ability to obtain timely financing on reasonable terms when required; the current and future social, economic and political conditions; and other assumptions and factors generally associated with the mining industry. Other than as required by applicable securities laws, the Company does not assume any obligation to update forward-looking statements if circumstances or management’s assumptions, beliefs, expectations or opinions should change, or changes in any other events affecting such statements. Although the Company has attempted to identify important factors that could cause actual results to differ materially, there may be other factors that cause results not to be as anticipated, estimated, described or intended. For the reasons set forth above, investors should not place undue reliance on forward-looking statements.