VANCOUVER, British Columbia – May 21, 2015 – Silvercorp Metals Inc. (“Silvercorp” or the “Company”) (TSX: SVM) (NYSE: SVM) today reported its financial and operating results for the fourth quarter and fiscal year ended March 31, 2015 (“Fiscal 2015”).
The Company is pleased that management enhancements and operational improvements enacted in Fiscal 2015 to address the lower commodity price environment have favourably impacted all aspects of operations, with improvements in head grade and mining tonnage, resulting in improved cash flow and adjusted net income.
FISCAL YEAR 2015 HIGHLIGHTS
- Silver sales of 5.1 million ounces, lead sales of 51.5 million pounds and zinc sales of 15.9 million pounds, up 33%, 39%, and 89% from the prior year;
- Silver and lead head grades at the Ying Mining District improved 16% and 24% compared to the prior year period;
- Sales of $128.5 million, up 19% from the prior year;
- Gross margin of 43% compared with 45% in the prior year, relatively steady despite a 13% decline in the average selling price of silver from the prior year;
- Cash flow from operations up 50.0% to $54.1 million, or $0.32 per share, compared to $36.1 million or $0.21 per share in the prior year period;
- Adjusted net income attributable to equity shareholders of $15.2 million, or $0.09 per share, compared to adjusted net income attributable to equity shareholders of $7.6 million, or $0.04 per share in the prior year period;
- Cash cost per ounce of silver, net of by-product credits, of $0.22, compared to $2.16 in the prior year;
- All-in sustaining cost per ounce of silver, net of by-product credits, of $11.75, compared to $16.33 in the prior year;
- General and administrative costs decreased by 16% to $20.6 million compared to $24.4 million in the prior year; and
- GC mine obtained its safety production permit and ramped up to commercial production, producing 204,925 tonnes of ore with metal sales of 501,000 ounces of silver, 4.8 million pounds of lead, and 9.4 million pounds of zinc; and,
- Ended the fiscal year with $69.5 million in cash and short term investments.
FOURTH QUARTER HIGHLIGHTS
- Silver sales of 0.9 million ounces, an increase of 58% compared to the same prior year period;
- Lead sales of 9.2 million pounds and zinc sales of 2.5 million pounds, up 78% and 188%, respectively, compared to the same prior year period;
- Sales of $20.3 million, an increase of 26% compared to the same prior year period;
- Gross margin of 26% down from 43%, impacted by the decline of metal prices and the inclusion of lower profit margin operations at the GC mine;
- Cash flow from operations of $4.8 million, or $0.03 per share ;
- Adjusted net loss of $0.2 million, or $0.00 per share;
- Cash cost per ounce of silver, net of by-product credits, of $0.89; and,
- All in sustaining cost per ounce of silver, net of by-product credits, of $13.37.
FINANCIALS
- Fiscal 2015 vs. Fiscal 2014
For the year ended March 31, 2015, net loss in Fiscal 2015 was $108.7 million compared to $48.4 million in Fiscal 2014. Net loss in the current fiscal year includes non-cash impairment charges of $130.3 million, which reduced the carrying value of the GC mine and XHP project to reflect lower metal prices. Net loss attributable to equity holders of the Company was $103.1 million, or $0.60 per share compared to $41.0 million, or $0.24 per share in Fiscal 2014. Excluding the non-cash impairment charges, adjusted net income attributable to shareholders was $15.2 million, or $0.09 per share, compared to $7.6 million, or $0.04 per share, in Fiscal 2014. Adjusted net income acts as a supplemental financial measure that provides a more complete assessment of the Company’s operations for the year.
In the current fiscal year, the Company’s financial results were mainly impacted by the following: (i) increase in silver, lead, and zinc production of 33%, 39%, and 89%, respectively, compared to the prior fiscal year, (ii) increased metal sales of $20.1 million, or 19%, compared to the prior fiscal year, of which $16.1 million was added from the new commercial production at the GC mine, (iii) a 16% decrease in general and administrative spending compared to the prior year, (iv) lower metal prices, as the realized selling price for silver and lead at the Ying Mining District dropped by 11% and 4%, respectively, and (v) lower gold production and sales, as the BYP mine was placed on care and maintenance in the current year.
In Fiscal 2015, the Company realized sales of $128.5 million compared to $108.4 million in Fiscal 2014.
Cost of sales in Fiscal 2015 was $73.7 million compared to $60.0 million in Fiscal 2014 and included cash costs of $53.0 million compared to $47.9 million in Fiscal 2014. The 23% increase in cost of sales is mainly due to 28% increase in ore production along with a 43% increase in per tonne non cash production cost to include GC mine’s production results. Per tonne cash production cost in Fiscal 2015 was $65.91 compared to $65.59 per tonne cash production cost in Fiscal 2014.
In Fiscal 2015, the gross profit margin was 43% compared to 45% in Fiscal 2014. The inclusion of the 5% gross profit margin from GC mine reduced the average gross profit margin. Ying Mining District’s gross profit margin achieved 48% in the current year. The decrease in overall gross profit margin was also due to lower realized metal prices for silver and increased per tonne production costs.
The non-cash impairment charge of $130.3 million recognized in Fiscal 2015, of which $101.0 million related to the GC mine and $29.4 million related to the XHP project, was based on the discounted cash flows for each of the two properties. The discounted cash flows used estimated silver prices of $16.43 per ounce in 2015, increasing to $18.75 per ounce from 2016 to 2019 and long-term silver prices of $20.24 from 2020 onwards. The discount rates used for the GC Mine and the XHP Project were 13.5% and 15% respectively, which reflects the weighted average cost of capital of a market participant, adjusted for asset specific risks, in particular the size, stage of development, and the commodity for each property.
Cash flow from operations in Fiscal 2015 was $54.1 million or $0.32 per share, compared to $36.1million, or $0.21 per share, in Fiscal 2014. The Company ended the fiscal year with $69.5 million in cash, cash equivalents and short-term investments.
- Q4 Fiscal 2015 vs. Q4 Fiscal 2014
For the quarter ended March 31, 2015 (“Q4 Fiscal 2015”), net loss was $130.1 million compared to $4.7 million in the three months ended March 31, 2014 (“Q4 Fiscal 2014”). Net loss in the current quarter includes a $130.3 million non-cash impairment charges on the carrying value of mineral rights and properties, plant at GC mine and XHP project to reflect lower metal prices. Net loss attributable to equity holders of the Company was $118.5 million or $0.69 per share compared to $4.5 million or $0.03 per share in the quarter ended March 31, 2014 (“Q4 Fiscal 2014”). Excluding the non-cash impairment charges, adjusted net loss attributable to the equity holders in the quarter was $0.2 million or $0.00 per share (Q4 Fiscal 2014 – adjusted net income of $1.1 million, or $0.01 per share).
The loss incurred in the current quarter was mainly due to: (i) a 16% decrease in the realized price for silver, from $16.13 in Q4 Fiscal 2014 to $13.48 in Q4 Fiscal 2015 in the Ying Mining District, (ii) higher mining and milling costs in the fourth quarter resulting from the allocation of fixed costs, to a reduced tonnage of ore mined and milled in the fourth quarter, (iii) reduced tonnage of ore mined due to the Chinese New Year which results in mine operations of only two months in the quarter; (iv) reduced tonnage at the SGX mine as a result of work interruptions related to the non-renewal of a contract with a one of eight mining contractors, and, iv) a $0.7 million write down of inventories at the GC mine.
In Q4 Fiscal 2015, the Company realized sales of $20.3 million compared to $16.1 million in the same quarter last year. The increase in sales was mainly due to the increase of metals produced offset by the decline of metal prices.
Cost of sales in Q4 Fiscal 2015 was $15.0 million compared to $9.2 million in Q4 Fiscal 2014. The cost of sales included $8.2 million (Q4 Fiscal 2014 – $7.8 million) cash costs, $6.1 million (Q4 Fiscal 2014 – $1.4 million) depreciation, amortization and depletion charges, and a $0.7 million write down of inventories at the GC mine (Q4 Fiscal 2014 – $nil). The increase in cost of sales is mainly due to a 43% increase in ore production along with higher per tonne production costs arising from i) higher cash mining cost at the Ying Ming District as more in-stope drilling and higher cost re-suing mining methods were used to achieve better grade control, and ii) the inclusion of GC mine’s production results. Benefiting from the improved head grades, cash cost per ounce of silver at the Ying Ming District reduced to $1.58 in Q4 Fiscal 2015 compared to $2.82 in Q4 Fiscal 2014.
The gross profit margin in Q4 Fiscal 2015 was 26%, compared to 43% in Q4 Fiscal 2014, and the decrease was mainly due to the decrease of metal prices and the inclusion of lower gross profit margins from the GC mine operations.
Cash flow from operations in Q4 Fiscal 2015 was $4.8 million or $0.03 per share, compared to $3.1 million, or $0.02 per share, in Q4 Fiscal 2014.
OPERATIONS AND DEVELOPMENT
- Fiscal 2015 vs. Fiscal 2014
In Fiscal 2015, on a consolidated basis, the Company sold 5.1 million ounces of silver, 5,900 ounces of gold, 51.5 million pounds of lead and 15.9 million pounds of zinc, compared to 3.9 million ounces of silver, 11,124 ounces of gold, 37.2 million pounds of lead and 8.4 million pounds of zinc in Fiscal 2014.
Ying Mining District, Henan Province, China
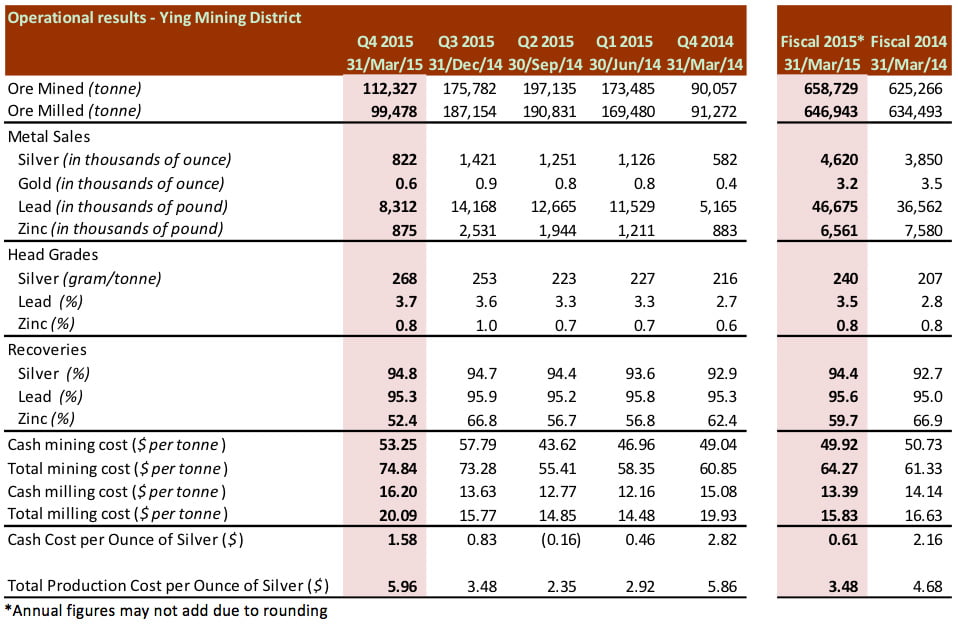
In Fiscal 2015, the total ore mined at the Ying Mining District was 658,729 tonnes, an increase of 5% compared to total ore production of 625,266 tonnes in Fiscal 2014. Silver and lead head grades improved by 16% and 24%, respectively, to 240 gram per tonne (“g/t”) for silver and 3.5% for lead from 207 g/t for silver and 2.8% for lead in Fiscal 2014.
In Fiscal 2015, the Ying Mining District sold 4.6 million ounces of silver, 3,200 ounces of gold, 46.7 million pounds of lead, and 6.6 million pounds of zinc, compared to 3.9 million ounces of silver, 3,527 ounces of gold, 36.6 million pounds of lead, and 7.6 million pounds of zinc in Fiscal 2014. The increase in metals sold is mainly due to the higher ore output and improved head grades in Fiscal 2015.
Total and cash mining costs per tonne were $64.27 and $49.92, respectively, compared to $61.33 and $50.73, respectively, in Fiscal 2014. The overall decrease in cash mining costs per tonne was a result of the improvement in dilution and cost control.
In Fiscal 2015, total ore milled at Ying Mining District was 646,943 tonnes, an increase of 2% compared to 634,493 tonnes in Fiscal 2014. Cash milling costs were $13.39 per tonne of ore milled compared to $14.14 in Fiscal 2014. The decrease in per tonne milling costs is due to higher tonnage processed and better cost control.
During the year, the Company completed approximately 78,018 metres (“m”) of horizontal tunnels, raises and declines and 63,880 m diamond drilling. Excluding the capitalization of the mineral right fee of $17.4 million related to the renewal of SGX mine for another ten years, total capitalized exploration and development expenditures for the Ying Mining District were $30.4 million compared to $30.4 million in Fiscal 2014.
GC Mine, Guangdong Province, China
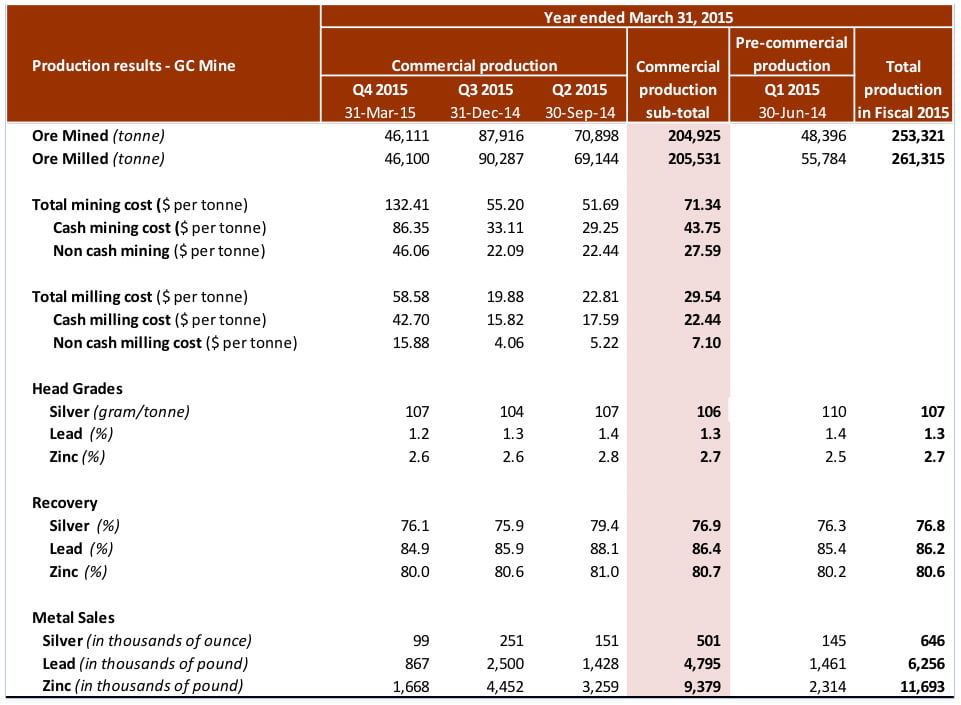
Total ore mined at GC mine in Fiscal 2015 was 253,321 tonnes, of which 204,925 tonnes were mined since commercial production at a total mining cost and a cash mining cost of $71.34 and $43.75, respectively, while 48,396 tonnes were mined during the pre-commercial period in the first quarter of fiscal 2015.
Total ore milled at GC mine in Fiscal 2015 was 261,315 tonnes, of which 205,531 tonnes were milled after commercial production was declared at a total milling cost and a cash milling cost of $29.54 and $22.44, while 55,784 tonnes were milled during the pre-commercial period in the first quarter of fiscal 2015. Higher mining and milling costs in the fourth quarter resulted from the allocation of fixed costs to a reduced tonnage of ore mined and milled in the fourth quarter due to the Chinese New Year, which reduced mine operations to only two months during the quarter.
The head grades at GC mine were 107 g/t for silver, 1.3% for lead, and 2.7% for Zinc while the recovery rates were 76.8% for silver, 86.2% for lead, and 80.6% for zinc in Fiscal 2015. As Fiscal 2015 was the first production year at GC mine, comparable information was not available.
In Fiscal 2015, the Company sold 0.6 million ounces of silver, 6.3 million pounds of lead, and 11.7 pounds of zinc. Revenue realized before commercial production was treated as a credit and directly offset the development expenditures incurred at the GC mine. Revenue contributed by GC mine since commercial production commenced in July 2014 was $16.1 million.
During the year, the Company completed approximately 12,970 m of horizontal tunnels, raises and declines and 21,381 m of diamond drilling. Total capitalized exploration and development expenditures for the GC mine was $3.3 million compared to $15.9 million in Fiscal 2014.
BYP Mine, Hunan Province, China
Certain capital upgrades are necessary at the BYP mine in order to sustain ongoing production, however, in consideration of the required expenditures and the current market environment, the Company has decided to defer such capital investments until a later time. As such, in August 2014, the Company suspended mining activities and put the BYP mine into care and maintenance. The BYP mine is not a core asset and the Company is considering various strategic alternatives for this project.
In Fiscal 2015, the BYP mine processed 48,844 tonnes of ore compared to 88,297 tonnes in the same prior year period. During the same time periods, the Company sold 2,711 ounces of gold compared to 7,416 ounces of gold in the prior year. Gold head grade was 2.7 g/t compared to 3.4 g/t in prior year.
- Q4 Fiscal 2015 vs. Q4 Fiscal 2014
In Q4 Fiscal 2015, on a consolidated basis, the Company sold 0.9 million ounces of silver, 600 ounces of gold, 9.2 million pounds of lead, and 2.5 million of zinc, compared to 0.6 million ounces of silver, 2,300 ounce of gold, 5.2 million of lead, and 0.9 million of zinc. The increase was mainly due to the improved dilution controls at the Ying Mining District and higher metal production contributed by the GC mine.
Ying Mining District, Henan Province, China
In Q4 Fiscal 2015, the Company mined 112,327 tonnes of ore at the Ying Mining District compared to 90,057 tonnes in Q4 Fiscal 2014. During the quarter, metals sold totaled 0.8 million ounces of silver, 600 ounces of gold, 8.3 million pounds of lead and 0.9 million pounds of zinc, compared to 0.6 million ounces of silver, 461 ounces of gold, 5.2 million pounds of lead, and 0.9 million pounds of zinc in Q4 Fiscal 2014. The increase in metals sold is mainly due to the higher ore output and improved head grades in the current quarter.
Head grades were 268 grams per tonne (“g/t”) for silver, 3.7% for lead and 0.8% for zinc, compared to 216 g/t for silver, 2.7% for lead and 0.6% for zinc in the same quarter last year, benefiting from ongoing dilution and operation improvement in Fiscal 2015.
During the quarter, the Company renewed mining contracts with seven out of eight of its mining contractors for a further two-year term and terminated one mining contractor upon the expiration of its contract at the end of February, 2015. The Company also entered into contracts with three new mining contractors to replace the terminated contractor who previously worked out of three portals at the SGX Mine. Regrettably, the changeover process for the terminated contractor was slow as the Company and the terminated contractor have had disagreements and protracted negotiations regarding the final bill payment. The changeover difficulties impacted March’s production at the SGX mine and the Ying Mining District by 40% and 15% respectively. At the end of March 2015, the terminated contractor departed from two of the three occupied portals, which subsequently returned to normal operations. The Company is still negotiating for the withdrawal from the last portal, and at this time, it does not anticipate that this disruption will materially impact the production guidance for fiscal 2016.
In Q4 Fiscal 2015, total and cash mining costs per tonne were $74.84 and $53.25, respectively, compared to $60.85 and $49.04 in Q4 Fiscal 2014, respectively. The increase of cash mining costs was due to using (i) more in-stope diamond drilling and (ii) greater use of higher cost re-suing mining method to achieve better grade and dilution control in the current quarter.
In Q4 Fiscal 2015, a total of 99,478 tonnes of ore were milled compared to 91,272 tonnes in Q4 Fiscal 2014. The cash milling cost per tonne was $16.20 in Q4 Fiscal 2015 compared to $15.08 in Q4 Fiscal 2014.
Total and cash costs per ounce of silver in Q4 Fiscal 2015 for the Ying Mining District were $5.96 and $1.58 respectively, compared to $5.86 and $2.82, in Q4 Fiscal 2014, respectively.
GC Mine, Guangdong Province, China
In Q4 2015, 46,111 tonnes of ore were mined at the GC mine at a total mining cost and cash mining cost of $132.41 and $86.35, respectively, while 46,100 tonnes of ore were milled at a total milling cost and cash milling cost of $58.58 and $42.70. The mining cost and milling cost per tonne in Q4 2015 was substantial higher than the annual average cost because of the allocation of fixed costs to a reduced tonnage of ore mined and milled in the fourth quarter due to the Chinese New Year, which results in mine operations of only two months in the quarter.
Head grades were 107 grams per tonne (“g/t”) for silver, 1.2% for lead and 2.6% for zinc with recovery rates of 76.1% for silver, 84.9% for lead, and 80.0% for zinc in Q4 2015. The head grades and recovery rates are comparable to the annual average at the GC mine.
Total and cash costs per ounce of silver in Q4 Fiscal 2015 for the GC Mine were $21.19 and negative $4.81 respectively.
Changes to Senior Management
Mr. Alex Zhang, M. Eng., M.Sci., P. Geo., has joined Silvercorp as Vice-President of Exploration. Mr. Zhang has 20 years of experience and has worked with Eldorado Gold, Afcan Mining, Sino Gold, and most recently with the Company’s affiliate, New Pacific Metals Corp. Mr. Zhang has supervised the exploration activities of two major gold projects from exploration through development to production, and brings a full range of technical and managerial skills related to exploration and mining projects. Mr. Zhang will also act as the Qualified Person for Silvercorp under NI 43-101, replacing Ruijin Jiang who is retiring at the end of June.
Mr. Luke Liu, M. Eng. PhD (Mining Eng.), has joined Silvercorp as Vice President China Operations. Mr. Liu has over 20 years mining industry experience in Australia and internationally, including China. He has held a diverse range of technical and engineering positions in mining companies and consulting firms and has demonstrated abilities running a modern mining operation. Based out of the Beijing office, Mr. Liu’s duties include leading strategic mine planning, improving mine operation processes, and ensuring that mining operations match or exceed production goals and budgets.
Mr. Myles Gao, President, Corporate Development and a director, will be resigning effective May 31, 2015. The Company thanks Mr. Gao for his contributions to the Company in his various capacities during his 12 years of service with the Company and wishes him continued success in his future plans.
Dividend Announcement
Silvercorp’s Board of Directors has declared a quarterly dividend of CAD$0.005 per share (CAD$0.02 per share on an annual basis) to be paid on or before July 21, 2015, to shareholders of record at the close of business on June 30, 2015. The dividends are considered eligible dividends for Canadian tax purposes.
Alex Zhang, P.Geo., Vice President, Exploration, is the Qualified Person for Silvercorp under NI 43-101 and has reviewed and given consent to the technical information contained in this News Release.
This earnings release should be read in conjunction with the Company’s Management Discussion & Analysis, Financial Statements and Notes to Financial Statements for the corresponding period, which have been posted on SEDAR at www.sedar.com and are also available on the Company’s website at www.silvercorp.ca. All figures are in United States dollars unless otherwise stated.
About Silvercorp
Silvercorp is a low-cost silver-producing Canadian mining company with multiple mines in China. The Company is currently developing the GC project in southern China which it expects will become its next operating mine. The Company’s vision is to deliver shareholder value by focusing on the acquisition of under developed projects with resource potential and the ability to grow organically. For more information, please visit our website at www.silvercorp.ca.
For further information
Silvercorp Metals Inc.
Lorne Waldman
Senior Vice President
Phone: (604) 669-9397
Toll Free 1(888) 224-1881
Email: investor@silvercorp.ca
Website: www.silvercorp.ca
CAUTIONARY DISCLAIMER – FORWARD LOOKING STATEMENTS
Certain of the statements and information in this press release constitute “forward-looking statements” within the meaning of the United States Private Securities Litigation Reform Act of 1995 and “forward-looking information” within the meaning of applicable Canadian provincial securities laws. Any statements or information that express or involve discussions with respect to predictions, expectations, beliefs, plans, projections, objectives, assumptions or future events or performance (often, but not always, using words or phrases such as “expects”, “is expected”, “anticipates”, “believes”, “plans”, “projects”, “estimates”, “assumes”, “intends”, “strategies”, “targets”, “goals”, “forecasts”, “objectives”, “budgets”, “schedules”, “potential” or variations thereof or stating that certain actions, events or results “may”, “could”, “would”, “might” or “will” be taken, occur or be achieved, or the negative of any of these terms and similar expressions) are not statements of historical fact and may be forward-looking statements or information. Forward-looking statements or information relate to, among other things: the price of silver and other metals; the accuracy of mineral resource and mineral reserve estimates at the Company’s material properties; the sufficiency of the Company’s capital to finance the Company’s operations; estimates of the Company’s revenues and capital expenditures; estimated production from the Company’s mines in the Ying Mining District; timing of receipt of permits and regulatory approvals; availability of funds from production to finance the Company’s operations; and access to and availability of funding for future construction, use of proceeds from any financing and development of the Company’s properties.
Forward-looking statements or information are subject to a variety of known and unknown risks, uncertainties and other factors that could cause actual events or results to differ from those reflected in the forward-looking statements or information, including, without limitation, risks relating to: fluctuating commodity prices; calculation of resources, reserves and mineralization and precious and base metal recovery; interpretations and assumptions of mineral resource and mineral reserve estimates; exploration and development programs; feasibility and engineering reports; permits and licences; title to properties; property interests; joint venture partners; acquisition of commercially mineable mineral rights; financing; recent market events and conditions; economic factors affecting the Company; timing, estimated amount, capital and operating expenditures and economic returns of future production; integration of future acquisitions into the Company’s existing operations; competition; operations and political conditions; regulatory environment in China and Canada; environmental risks; foreign exchange rate fluctuations; insurance; risks and hazards of mining operations; key personnel; conflicts of interest; dependence on management; internal control over financial reporting as per the requirements of the Sarbanes-Oxley Act; and bringing actions and enforcing judgments under U.S. securities laws.
This list is not exhaustive of the factors that may affect any of the Company’s forward-looking statements or information. Forward-looking statements or information are statements about the future and are inherently uncertain, and actual achievements of the Company or other future events or conditions may differ materially from those reflected in the forward-looking statements or information due to a variety of risks, uncertainties and other factors, including, without limitation, those referred to in the Company’s Annual Information Form for the year ended March 31, 2014 under the heading “Risk Factors”. Although the Company has attempted to identify important factors that could cause actual results to differ materially, there may be other factors that cause results not to be as anticipated, estimated, described or intended. Accordingly, readers should not place undue reliance on forward-looking statements or information.
The Company’s forward-looking statements and information are based on the assumptions, beliefs, expectations and opinions of management as of the date of this press release, and other than as required by applicable securities laws, the Company does not assume any obligation to update forward-looking statements and information if circumstances or management’s assumptions, beliefs, expectations or opinions should change, or changes in any other events affecting such statements or information. For the reasons set forth above, investors should not place undue reliance on forward-looking statements and information.