VANCOUVER, British Columbia – February 6, 2020 – Silvercorp Metals Inc. (“Silvercorp” or the “Company”) (TSX/NYSE American: SVM) reported its financial and operating results for the third quarter ended December 31, 2019 (“Q3 Fiscal 2020”). All amounts are expressed in US Dollars.
Q3 FISCAL YEAR 2020 HIGHLIGHTS
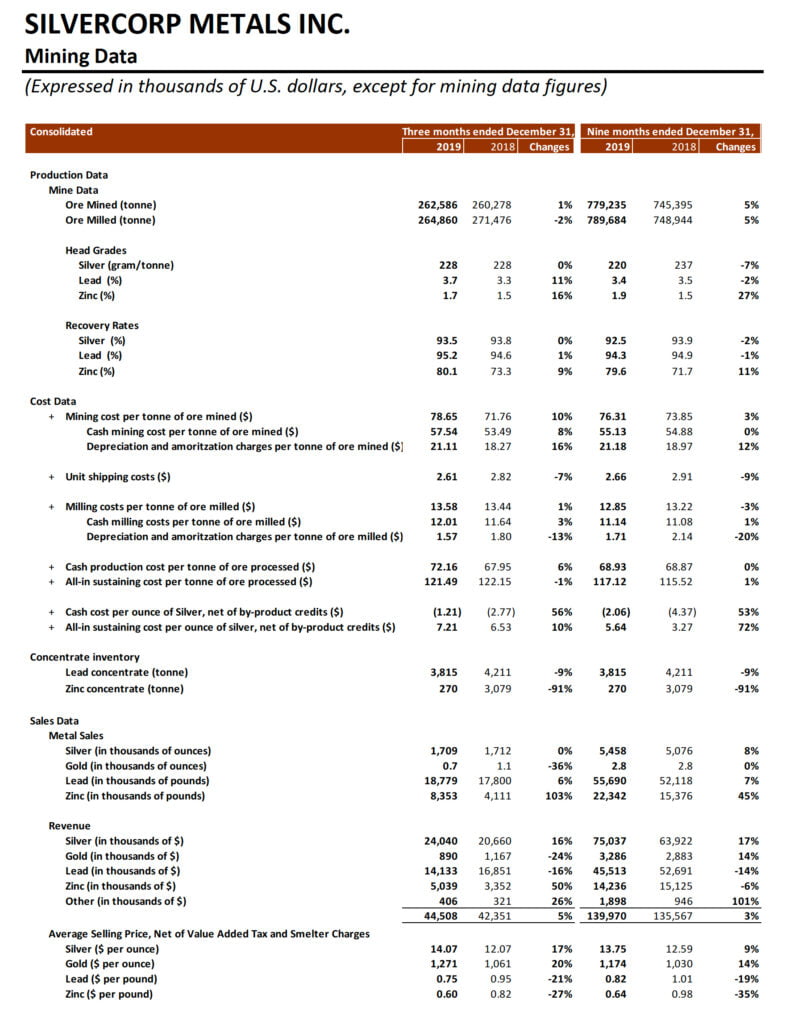
- Ore mined up 1% to 262,586 tonnes compared to the prior year quarter (“Q3 Fiscal 2019”);
- Sold approximately 1.7 million ounces of silver, 18.8 million pounds of lead, and 8.4 million pounds of zinc, up 0%, 6% and 103%, respectively, compared to 1.7 million ounces of silver, 17.8 million pounds of lead, and 4.1 million pounds of zinc in the prior year quarter while gold sold was 700 ounces, down 36% compared to 1,100 ounces in the prior year quarter;
- Ended the quarter with inventories of 3,815 tonnes of silver-lead concentrate and 270 tonnes of zinc concentrate, down 9% and 54%, compared to 4,176 tonnes of silver-lead concentrate and 586 tonnes of zinc concentrate as at September 30, 2019;
- Revenue up 5% to $44.5 million compared to the prior year quarter;
- Gross profit margin of 42% compared to 46% in the prior year quarter;
- Net income attributable to equity shareholders of $6.3 million, or $0.04 per share, a decrease of $2.4 million compared to $8.7 million, or $0.05 per share in the prior year quarter;
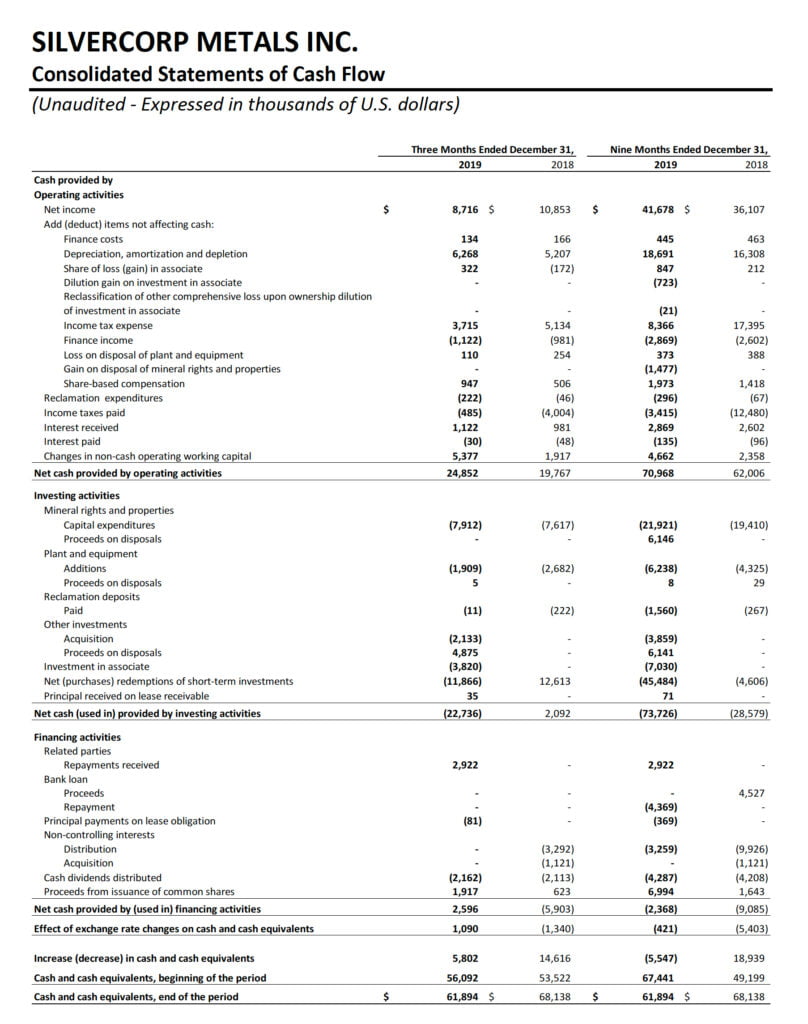
- Cash flow from operations of $24.9 million, up 26% compared to $19.8 million in the prior year quarter;
- Cash cost per ounce of silver1, net of by-product credits, of negative $1.21, compared to negative $2.77 in the prior year quarter;
- All-in sustaining cost per ounce of silver1, net of by-product credits, of $7.21, compared to $6.53 in the prior year quarter;
- Paid $2.2 million in dividends to the Company’s shareholder;
- Invested $3.8 million in New Pacific Metals Corp. (“NUAG”) through its public offering to maintain the Company’s ownership interest at 28.9%; and,
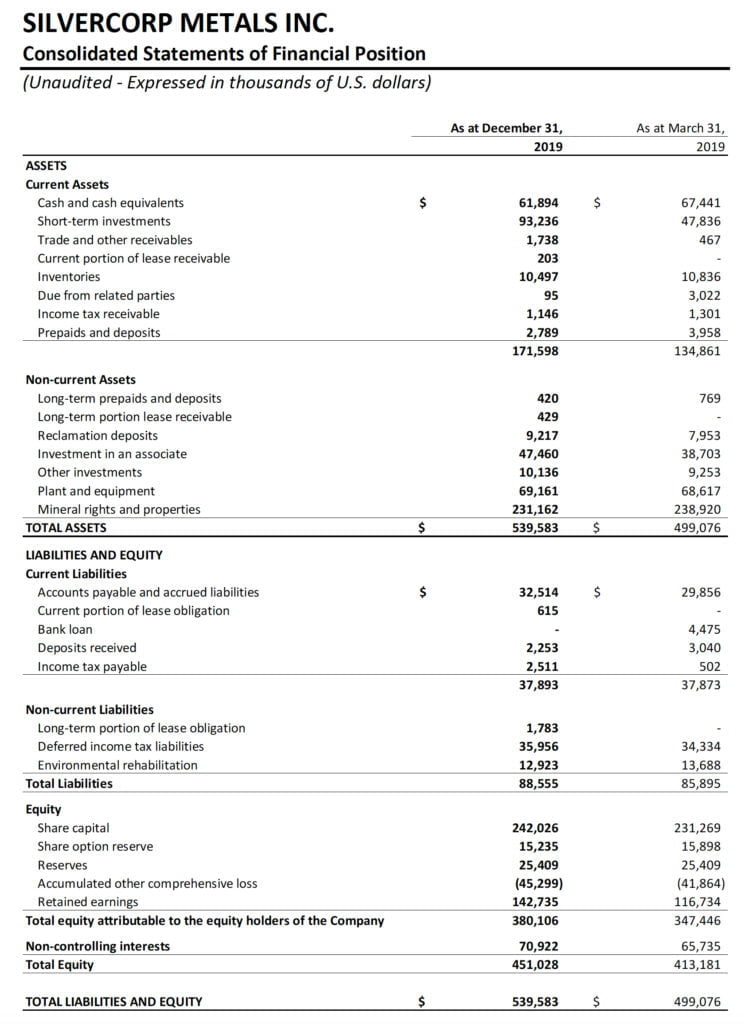
- Strong balance sheet with $155.1 million in cash and cash equivalents and short-term investments, an increase of $19.9 million or 15% compared to $135.2 million as at September 30, 2019.
FINANCIALS
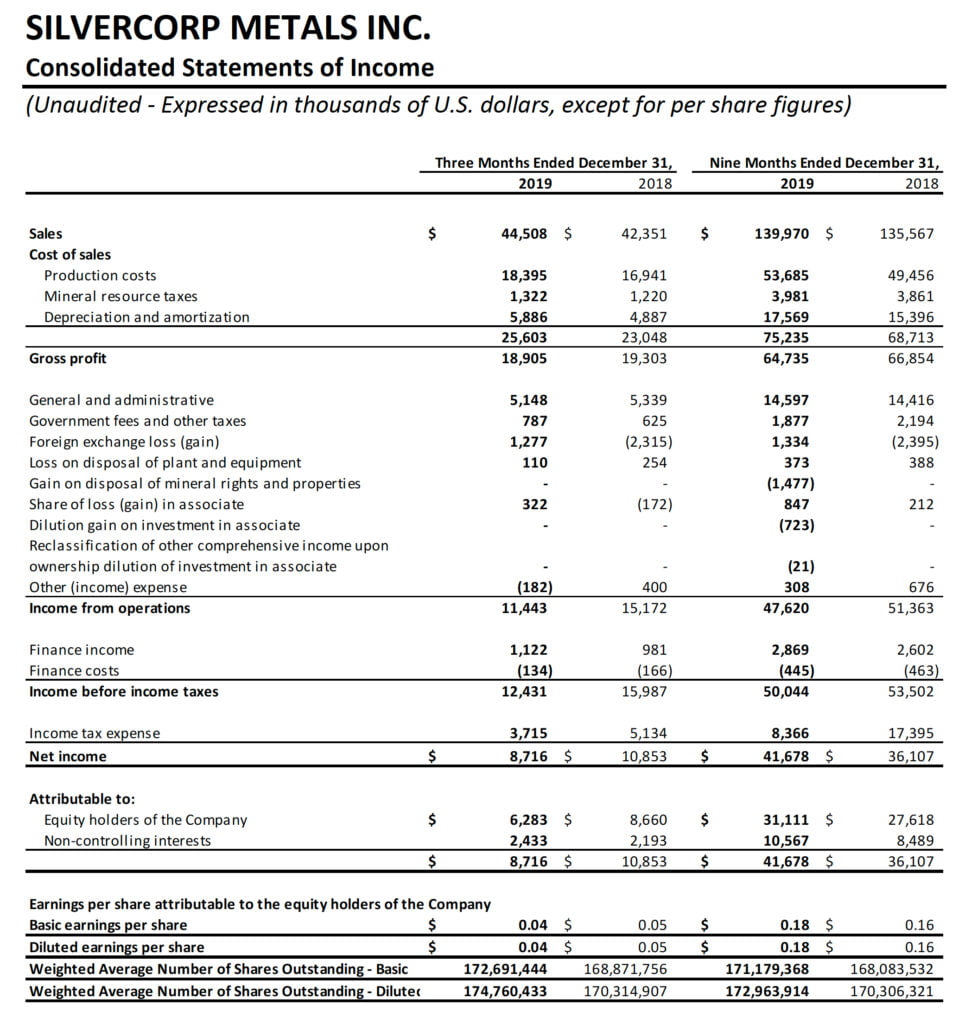
Net income attributable to equity shareholders of the Company in Q3 Fiscal 2020 was $6.3 million, or $0.04 per share, a decrease of $2.4 million, compared to $8.7 million, or $0.05 per share in the third quarter ended December 31, 2018.
Compared to Q3 Fiscal 2019, the Company’s financial results in Q3 Fiscal 2020 were mainly impacted by i) increases of 17% and 20% in the average realized selling prices for silver and gold; ii) an increases of 6% and 103% of lead and zinc sold; offset by iii) a decreases of 21% and 27% in the average realized selling prices for lead and zinc, and iv) a $1.3 million foreign exchange loss.
Sales in Q3 Fiscal 2020 were $44.5 million, up 5% or $2.1 million, compared to $42.4 million in Q3 Fiscal 2019. Silver, gold, and base metals sales represented $24.0 million, $0.9 million, and $19.6 million, respectively, compared to $20.7 million, $1.2 million, and $20.5 million, respectively, in Q3 Fiscal 2019.
Cost of sales in Q3 Fiscal 2020 was $25.6 million, an increase of $2.6 million or 11%, compared to $23.0 million in Q3 Fiscal 2019. The cost of sales included $18.4 million of cash production costs (Q3 Fiscal 2019 – $16.9 million), $1.3 million of mineral resources tax (Q3 Fiscal 2019 – $1.2 million), and $5.9 million depreciation and amortization charges (Q3 Fiscal 2019 – $4.9 million). The increase was mainly due to more metals sold and an increase of 6% in cash production costs per tonne of ore processed.
Gross profit margin in Q3 Fiscal 2020 was 42%, compared to 46% in Q3 Fiscal 2019. Ying Mining District’s gross profit margin was 46% compared to 47% in Q3 Fiscal 2019. GC Mine’s gross profit margin was 28% compared to 38% in Q3 Fiscal 2019.
General and administrative expenses in Q3 Fiscal 2020 were $5.1 million, compared to $5.3 million in Q3 Fiscal 2019.
Foreign exchange loss in Q3 Fiscal 2020 was $1.3 million compared to a foreign exchange gain of $2.4 million in Q3 Fiscal 2019. The foreign exchange gain or loss is mainly driven by the fluctuation of the US dollar against the Canadian dollar.
Share of loss in an associate in Q3 Fiscal 2020 was $0.3 million compared to $0.2 million gain in Q3 Fiscal 2019. The loss represents the Company’s equity pickup in NUAG.
Income tax expenses in Q3 Fiscal 2020 were $3.7 million compared to $5.1 million in Q3 Fiscal 2019. The income tax expense recorded in Q3 Fiscal 2020 included current income tax expense of $2.8 million (Q3 Fiscal 2019 – $4.4 million) and deferred income tax expense of $0.9 million (Q3 Fiscal 2019 – $0.8 million).
Cash flow provided by operating activities in Q3 Fiscal 2020 was $24.9 million, an increase of $5.1 million, compared to $19.8 million in Q3 Fiscal 2019.
For the nine months ended December 31, 2019, net income attributable to equity shareholders of the Company was $31.1 million or $0.18 per share, an increase of $3.5 million, compared to $27.6 million or $0.16 per share in the same prior year period; sales were $140.0 million, up 3% or $4.4 million from $135.6 million in the same prior year period; the share of loss in NUAG was $0.8 million, compared to $0.2 million in the same prior year period; and cash flow from operating activities was $71.0 million after changes in working capital, up 14% or $9.0 million from $62.0 million in the same prior year period.
The Company ended Q3 Fiscal 2020 with $155.1 million in cash and short-term investments, an increase of $19.9 million or 15%, compared to $135.2 million as at September 30, 2019.
Working capital as at December 31, 2019 was $133.7 million, an increase of $8.7 million or 7%, compared to $125.0 million as at September 30, 2019.
OPERATIONS AND DEVELOPMENT
i) Q3 Fiscal 2020 vs. Q3 Fiscal 2019
In Q3 Fiscal 2020, on a consolidated basis, the Company mined 262,586 tonnes of ore, an increase of 1% or 2,308 tonnes, compared to 260,278 tonnes in Q3 Fiscal 2019. Ore mined at the Ying Mining District and the GC Mine increased by 1,997 tonnes and 311 tonnes, respectively. Ore milled was 264,860 tonnes, down 2% compared to 271,476 tonnes in Q3 Fiscal 2019.
In Q3 Fiscal 2020, the Company sold approximately 1.7 million ounces of silver, 18.8 million pounds of lead, and 8.4 million pounds of zinc, up 0%, 6%, and 103%, respectively, compared to 1.7 million ounces of silver, 17.8 million pounds of lead, and 4.1 million pounds of zinc in Q3 Fiscal 2019 while gold sold was 700 ounces, down 36% compared to 1,100 ounce in Q3 Fiscal 2019. As at December 31, 2019, the Company had inventories of 3,815 tonnes of silver-lead concentrate and 270 tonnes of zinc concentrate, down 9% and 54%, respectively, compared to 4,176 tonnes of silver-lead concentrate and 586 tonnes of zinc concentrate as at September 30, 2019.
In Q3 Fiscal 2020, the consolidated total mining costs and cash mining costs were $78.65 and $57.54 per tonne, an increase of 10% and 8%, respectively, compared to $71.76 and $53.49 per tonne, in Q3 Fiscal 2019. The increase in cash mining costs was mainly due to i) an increase of $0.6 million in mining preparation costs arising from additional tunnelling, and ii) an increase of $0.5 million in mining contractor costs. The consolidated total milling costs and cash milling costs in Q3 Fiscal 2020 were $13.58 and $12.01 per tonne, compared to $13.44 and $11.64 per tonne in Q3 Fiscal 2019.
The consolidated cash production costs per tonne of ore processed in Q3 Fiscal 2020 were $72.16, up 6% compared to $67.95 in Q3 Fiscal 2019. The consolidated all-in sustaining production costs per tonne of ore processed were $121.49, down 1% compared to $122.15 in Q3 Fiscal 2019, and below the Company’s Fiscal 2020 annual guidance of $125.50.
In Q3 Fiscal 2020, the consolidated cash cost per ounce of silver, net of by-product credits, was negative $1.21, compared to negative $2.77 in the prior year quarter. The increase was mainly due to an increase of $1.5 million in cash production costs and a decrease of $1.2 million in by-product credits resulting from lower net realized selling prices for lead and zinc, a decrease of 21% and 27%, respectively, partially offset by the increase of lead and zinc sold. Sales of lead and zinc in the current quarter amounted to $19.2 million, a decrease of $1.0 million, compared to $20.2 million in the prior year quarter.
In Q3 Fiscal 2020, the consolidated all-in sustaining costs per ounce of silver, net of by-product credits, were $7.21 compared to $6.53 in Q3 Fiscal 2019. The increase was mainly due to the increase in cash production costs and the decrease in by-product credits as discussed above.
In Q3 Fiscal 2020, on a consolidated basis, approximately 28,978 metres or $1.1 million worth of diamond drilling (Q3 Fiscal 2019 – 27,440 metres or $0.7 million) and 12,912 metres or $3.3 million worth of preparation tunnelling (Q3 Fiscal 2019 – 10,672 metres or $2.7 million) were completed and expensed as mining preparation costs. In addition, approximately 22,237 metres or $7.5 million worth of horizontal tunnels, raises, ramps and declines (Q3 Fiscal 2019 – 19,694 metres or $6.8 million) were completed and capitalized.
ii) Nine months ended December 31, 2019 vs. nine months ended December 31, 2018
For the nine months ended December 31, 2019, on a consolidated basis, the Company mined 779,235 tonnes of ore, an increase of 5% or 33,840 tonnes, compared to 745,395 tonnes mined in the same prior year period. Ore milled was 789,684 tonnes, up 5% or 40,740 tonnes, compared to 748,944 tonnes in the same prior year period.
The Company sold approximately 5.5 million ounces of silver, 2,800 ounces of gold, 55.7 million pounds of lead, and 22.3 million pounds of zinc, up 8%, 0%, 7%, and 45%, respectively, compared to 5.1 million ounces of silver, 2,800 ounces of gold, 52.1 million pounds of lead, and 15.4 million pounds of zinc sold in the same prior year period.
For the nine months ended December 31, 2019, the consolidated total mining costs and cash mining costs were $76.31 and $55.13 per tonne, respectively, compared to $73.85 and $54.88 per tonne in the same prior year period. The consolidated total milling costs and cash milling costs were $12.85 and $11.14, respectively, compared to $13.22 and $11.08 per tonne in the same prior year period.
Correspondingly, the consolidated cash production costs per tonne of ore processed for the nine months ended December 31, 2019 were $68.93, a slight increase compared to $68.87 in the same prior year period. The all-in sustaining production costs per tonne of ore processed were $117.12, an increase of 1%, compared to $115.52 in the same prior year period. However, both the cash production costs and all-in sustaining production costs per tonne were lower than the Company’s Fiscal 2020 annual guidance.
For the nine months ended December 31, 2019, the consolidated cash cost per ounce of silver, net of by-product credits, was negative $2.06, compared to negative $4.37 in the same prior year period. The increase was mainly due to a decrease of $2.22 in by-product credits per ounce of silver mainly resulting from lower net realized selling prices for lead and zinc. Sales of lead and zinc for the nine months ended December 31, 2019 amounted to $59.7 million, a decrease of $8.1 million, compared to $67.8 million in the same period year period. The consolidated all-in sustaining costs per ounce of silver, net of by-product credits was $5.64 compared to $3.27 in the same prior year period. The increase was mainly due to the decrease in by-product credits as discussed above and an increase of $3.1 million in sustaining capital expenditures.
For the nine months ended December 31, 2019, on a consolidated basis, approximately 93,544 metres or $3.0 million worth of diamond drilling (same prior year period – 91,735 metres or $2.5 million) and 37,224 metres or $9.6 million worth of preparation tunnelling (same prior year period – 32,073 metres or $8.7 million) were completed and expensed as mining preparation costs. In addition, approximately 63,736 metres or $22.0 million worth of horizontal tunnels, raises, ramps and declines (same prior year period – 56,035 metres or $20.0 million) were completed and capitalized.
i) Q3 Fiscal 2020 vs. Q3 Fiscal 2019
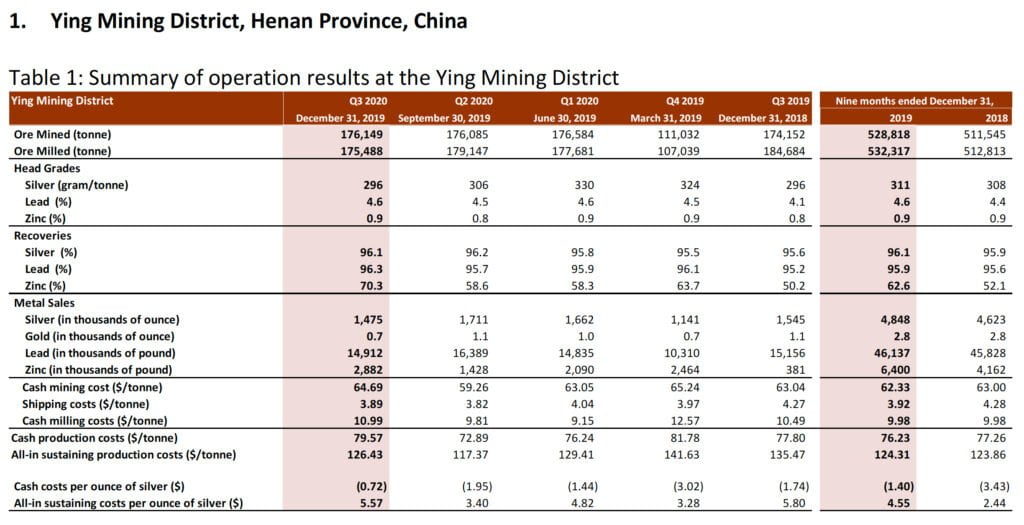
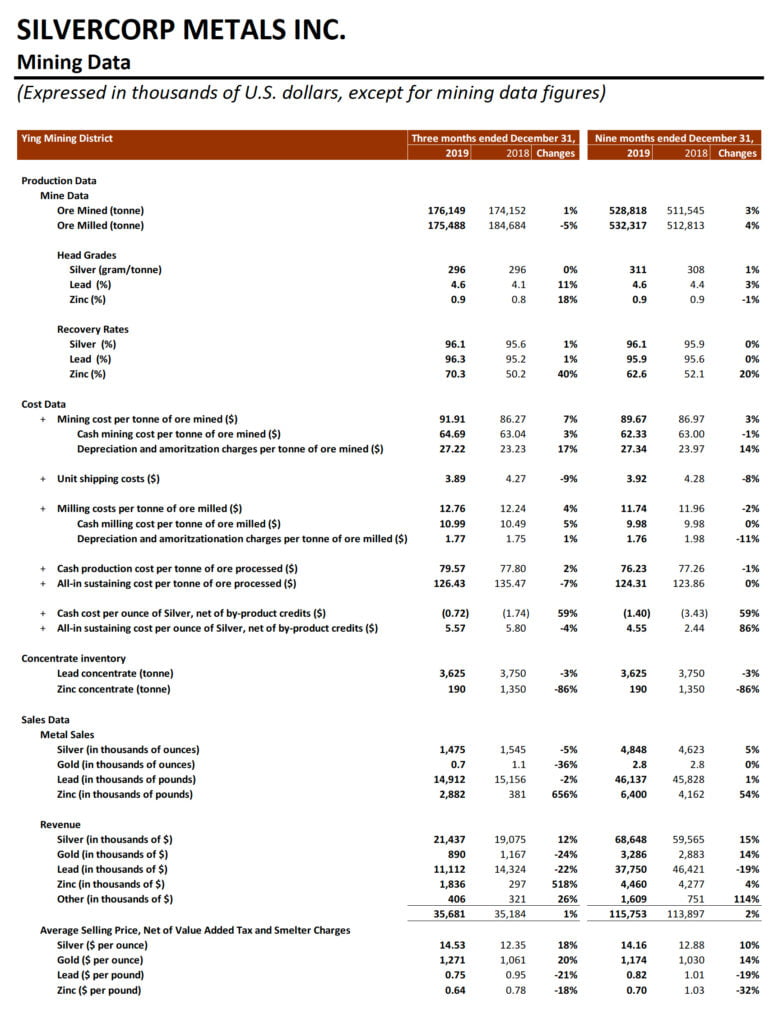
In Q3 Fiscal 2020, the total ore mined at the Ying Mining District was 176,149 tonnes, up 1% or 1,997 tonnes, compared to 174,152 tonnes in Q3 Fiscal 2019. Ore milled was 175,488 tonnes, down 5% or 9,196 tonnes, compared to 184,684 tonnes in Q3 Fiscal 2019.
Head grades of ore milled at the Ying Mining District in Q3 Fiscal 2020 were 296 grams per tonne (“g/t”) for silver, 4.6% for lead, and 0.9% for zinc, compared to 296 g/t for silver, 4.1% for lead, and 0.8% for zinc in Q3 Fiscal 2019.
In Q3 Fiscal 2020, the Ying Mining District sold approximately 1.5 million ounces of silver, 14.9 million pounds of lead, and 2.9 million pounds of zinc, compared to 1.5 million ounces of silver, 15.2 million pounds of lead, and 0.4 million pounds of zinc in Q3 Fiscal 2019. As at December 31, 2019, the Ying Mining District had inventories of 3,625 tonnes of silver-lead concentrate and 190 tonnes zinc concentrate, compared to 3,580 tonnes of silver-lead concentrate and 550 tonnes of zinc concentrate as at September 30, 2019.
Total and cash mining costs per tonne at the Ying Mining District in Q3 Fiscal 2020 were $91.91 and $64.69 per tonne, an increase of 7% and 3%, respectively, compared to $86.27 and $63.04 per tonne in Q3 Fiscal 2019. The increase in cash mining costs was mainly due to an increase of $0.4 million in mining preparation costs arsing from an increase of 14% tunneling expensed and ii) an increase of $0.3 million in mining contractor costs arising from an overall 3% increase in the mining contractors’ rate.
Total and cash milling costs per tonne at the Ying Mining District in Q3 Fiscal 2020 were $12.76 and $10.99, an increase of 4% and 5%, respectively, compared to $12.24 and $10.49 in Q3 Fiscal 2019. The increase in per tonne cash milling costs was mainly due to less ore milled resulting in a higher fixed costs per tonne allocation.
Correspondingly, the cash production costs per tonne of ore processed at the Ying Mining District in Q3 Fiscal 2020 were $79.57, up 2% compared to $77.80 in the prior year quarter. The all-in sustaining cash production costs per tonne of ore processed were $126.43, down 7% compared to $135.47 in the prior year quarter, and the decrease was mainly due to a decrease of $2.0 million in sustaining capital expenditures. The all-in sustaining cash production costs per tonne of ore processed at the Ying Mining District were below the Fiscal 2020 annual guidance of $130.20.
Cash cost per ounce of silver, net of by-product credits, in Q3 Fiscal 2020 at the Ying Mining District, was negative $0.72 compared to negative $1.74 in Q3 Fiscal 2019. The increase was mainly due to a decrease of $0.78 in by-product credits per ounce of silver resulting from lower lead and zinc net realized selling prices at the Ying Mining District. Sales from lead and zinc at the Ying Mining District in Q3 Fiscal 2020 were $12.9 million, a decrease of $1.7 million, compared to $14.6 million in Q3 Fiscal 2019.
All-in sustaining cost per ounce of silver, net of by-product credits, in Q3 Fiscal 2020 at the Ying Mining District was $5.57 compared to $5.80 in Q3 Fiscal 2019. The decrease was mainly due to the decrease in sustaining capital expenditures offset by the decrease in by-product credits as discussed above.
In Q3 Fiscal 2020, approximately 22,576 metres or $0.7 million worth of underground diamond drilling (Q3 Fiscal 2019 – 20,351 metres or $0.4 million) and 5,329 metres or $1.8 million worth of preparation tunnelling (Q3 Fiscal 2019 – 4,678 metres or $1.4 million) were completed and expensed as mining preparation costs at the Ying Mining District. In addition, approximately 22,105 metres or $10.5 million worth of horizontal tunnels, raises, ramps and declines (Q3 Fiscal 2019 – 19,361 metres or $6.7 million) were completed and capitalized.
ii) Nine months ended December 31, 2019 vs. nine months ended December 31, 2018
For the nine months ended December 31, 2019, a total of 528,818 tonnes of ore were mined at the Ying Mining District, an increase of 3% or 17,273 tonnes compared to 511,545 tonnes in the same prior year period. Ore milled was 532,317 tonnes, an increase of 4% or 19,504 tonnes compared to 512,813 tonnes in the same prior year period. Average head grades of ore processed were 311 g/t for silver, 4.6% for lead, and 0.9% for zinc compared to 308 g/t for silver, 4.4% for lead, and 0.9% for zinc in the same prior year period.
During the same time period, the Ying Mining District sold approximately 4.8 million ounces of silver, 2,800 ounces of gold, 46.1 million pounds of lead, and 6.4 million pounds of zinc, compared to 4.6 million ounces of silver, 2,800 ounces of gold, 45.8 million pounds of lead, and 4.2 million pounds of zinc in the same prior year period.
For the nine months ended December 31, 2019, the cash mining costs at the Ying Mining District were $62.33 per tonne, down 1% compared to $63.00 in the prior year period while the cash milling costs were $9.98 per tonne, unchanged compared to the prior year period.
Correspondingly, the cash production costs per tonne of ore processed were $76.23, down 1% compared to $77.26 in the prior year period. The all-in sustaining production costs per tonne of ore processed were $124.31, a slight increase compared to $123.86 in the prior year period. Both the cash production costs and all-in sustaining production costs per tonne were below its Fiscal 2020 annual guidance.
Cash cost per ounce of silver and all-in sustaining costs per ounce of silver, net of by-product credits, at the Ying Mining District, for the nine months ended December 31, 2019, were negative $1.40 and $4.55, respectively, compared to negative $3.43 and $2.44 in the same prior year period. The increase was mainly due to the decrease in by-product credits per ounce of silver and the increase in sustaining capital expenditures. Sales from lead and zinc at the Ying Mining District for the nine months ended December 31, 2019 were $42.2 million, a decrease of $8.5 million, compared to $50.7 million in the same prior year period.
For the nine months ended December 31, 2019, approximately 73,231 metres or $2.1 million worth of underground diamond drilling (same prior year period – 69,872 metres or $1.5 million) and 17,278 metres or $5.1 million worth of preparation tunnelling (same prior year period – 15,595 metres or $4.4 million) were completed and expensed as mining preparation costs at the Ying Mining District. In addition, approximately 62,661 metres or $24.3 million worth of horizontal tunnels, raises, and declines (same prior year period – 54,923 metres or $19.2 million) were completed and capitalized.
i) Q3 Fiscal 2020 vs. Q3 Fiscal 2019
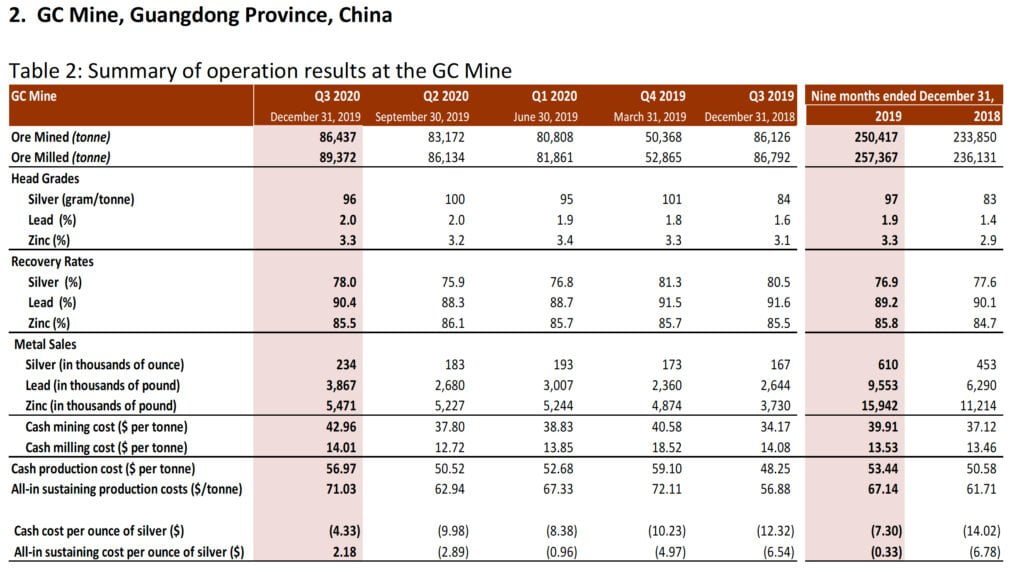
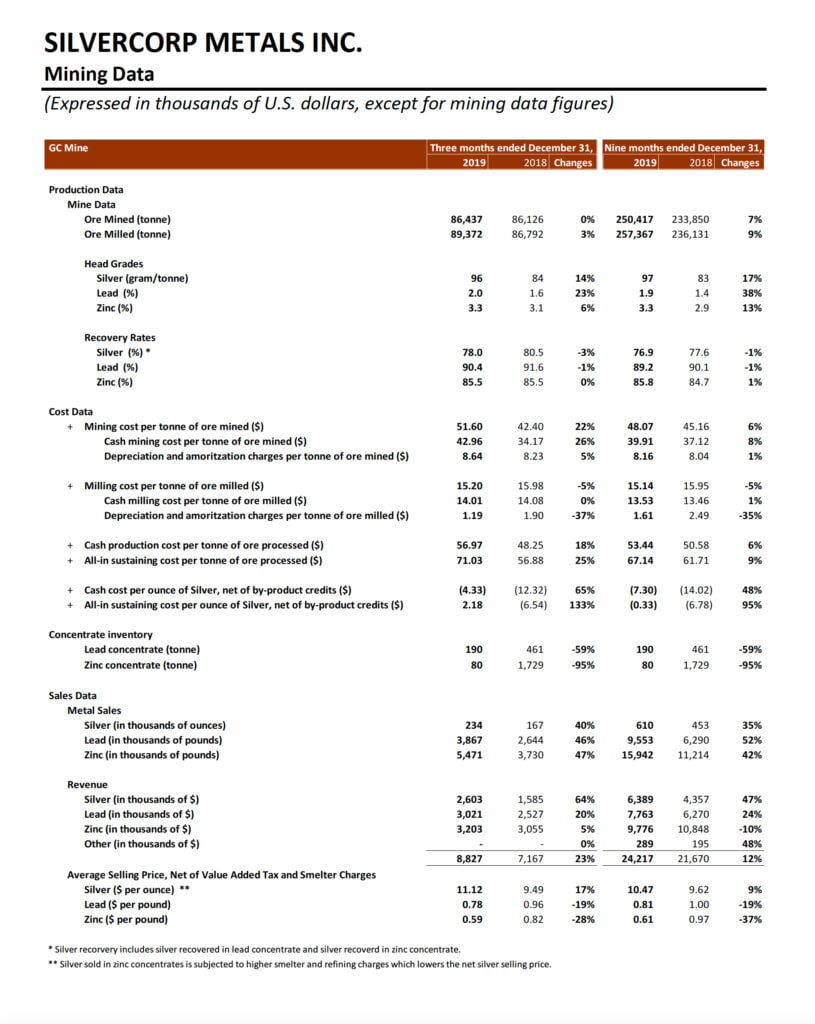
In Q3 Fiscal 2020, the total ore mined at the GC Mine was 86,437 tonnes, a slight increase compared to 86,126 tonnes in Q3 Fiscal 2019, while ore milled was 89,372 tonnes, an increase of 3% or 2,580 tonnes compared to 86,792 tonnes in Q3 Fiscal 2019. Average head grades of ore processed at the GC Mine were 96 g/t for silver, 2.0% for lead, and 3.3% for zinc compared to 84 g/t for silver, 1.6% for lead, and 3.1% for zinc in Q3 Fiscal 2019.
In Q3 Fiscal 2020, the GC Mine sold 234,000 ounces of silver, 3.9 million pounds of lead, and 5.5 million pounds of zinc, an increase of 40%, 46%, and 47%, respectively, compared to 167,000 ounces of silver, 2.6 million pounds of lead, and 3.7 million pounds of zinc sold in Q3 Fiscal 2019.
Total and cash mining costs per tonne at the GC Mine in Q3 Fiscal 2020 were $51.60 and $42.96 per tonne, respectively, an increase of 22% and 26% compared to $42.40 and $34.17 per tonne in Q3 Fiscal 2019. The increase was mainly due to i) an increase of $0.4 million in mining preparation costs resulting from more tunnelling expensed and ii) an increase of $0.2 million in direct mining contractor’s costs as more ore was mined using higher cost re-sueing mining method. Total and cash milling costs per tonne at the GC Mine in Q3 Fiscal 2020 were $15.20 and $14.01, respectively, compared to $15.98 and $14.08 in Q3 Fiscal 2019.
Correspondingly, cash production costs per tonne of ore processed were $56.97, an increase of 18% compared to $48.25 in Q3 Fiscal 2019, and all-in sustaining costs per tonne of ore processed were $71.03, an increase of 25% compared to $56.88 in Q3 Fiscal 2019.
Cash costs per ounce of silver, net of by-product credits, at the GC Mine, were negative $4.33 compared to negative $12.32 in Q3 Fiscal 2019. The increase was mainly due to i) the increase in cash production costs as discussed above, ii) the decrease in by-product credits per ounce of silver resulting from more silver sold, and iii) the decrease in lead and zinc realized selling prices. All-in sustaining costs per ounce of silver, net of by-product credits, in Q3 Fiscal 2020 at the GC Mine were $2.18 compared to negative $6.54 in Q3 Fiscal 2019.
In Q3 Fiscal 2020, approximately 6,402 metres or $0.3 million worth of underground diamond drilling (Q3 Fiscal 2019 – 7,089 metres or $0.3 million) and 6,599 metres or $1.5 million worth of tunnelling (Q3 Fiscal 2019 – 5,994 metres or $1.3 million) were completed and expensed as mining preparation costs at the GC Mine. In addition, approximately 532 metres or $0.3 million of horizontal tunnels, raises and declines (Q3 Fiscal 2019 – 333 metres or $0.1 million) were completed and capitalized.
ii) Nine months ended December 31, 2019 vs. nine months ended December 31, 2018
For the nine months ended December 31, 2019, a total of 250,417 tonnes of ore were mined and 257,367 tonnes were milled at the GC Mine, an increase of 7% and 9%, respectively, compared to 233,850 tonnes mined and 236,131 tonnes milled in the same prior year period. Average head grades of ore milled were 97 g/t for silver, 1.9% for lead, and 3.3% for zinc compared to 83 g/t for silver, 1.4% for lead, and 2.9% for zinc in the same prior year period.
During the same time period, the GC Mine sold approximately 610,000 ounces of silver, 9.6 million pounds of lead, and 15.9 million pounds of zinc, an increase of 35%, 52%, and 42%, respectively, compared to 453,000 ounces of silver, 6.3 million pounds of lead, and 11.2 million pounds of zinc in the same prior year period.
For the nine months ended December 31, 2019, the cash mining costs at the GC Mine were $39.91 per tonne, an increase of 8% compared to $37.12 per tonne in the same prior year period. The cash milling costs were $13.53 per tonne, a slight increase of 1% compared to $13.46 per tonne in the same prior year period. Correspondingly, the cash production costs per tonne of ore processed at the GC Mine were $53.44, an increase of 6% compared to $50.58 in the same prior year period. The all-in sustaining cash production costs per tonne of ore processed were $67.14 compared to $61.71 in the same prior year period.
Cash costs per ounce of silver and all-in sustaining costs per ounce of silver, net of by‐product credits, at the GC Mine, for the nine months ended December 31, 2019, were negative $7.30 and negative $0.33, respectively, compared to negative $14.02 and negative $6.78 in the same prior year period.
For the nine months ended December 31, 2019, approximately 20,313 metres or $0.9 million worth of underground diamond drilling (same prior year period – 21,863metres or $1.0 million) and 18,962 metres or $4.5 million of tunnelling (same prior year period – 16,478 metres or $4.3 million) were completed and expensed as mining preparation costs at the GC Mine. In addition, approximately 1,476 metres or $1.0 million of horizontal tunnels, raise, and declines (same prior year period – 1,112 metres or $0.8 million) were completed and capitalized.
Fiscal 2021 Production, Cash Cost, and Capital Expenditure Guidance
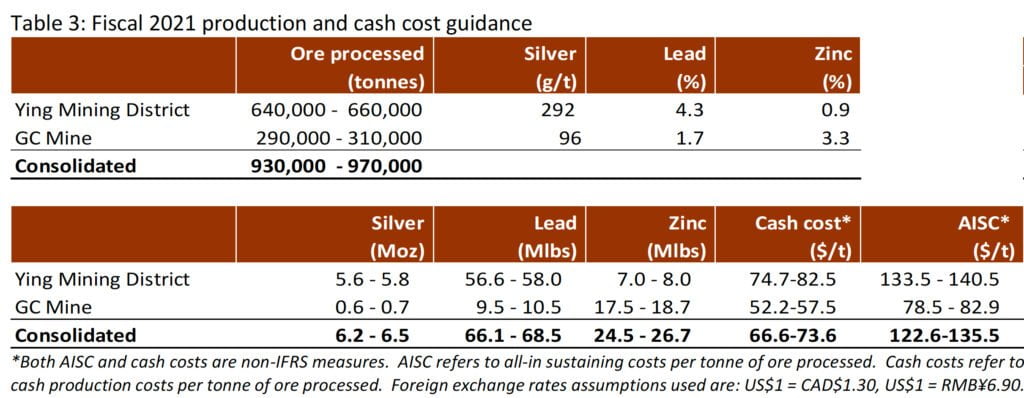
In Fiscal 2021, the Company expects to process approximately 930,000 – 970,000 tonnes of ore, yielding 6.2 million to 6.5 million ounces of silver, 66.1 million to 68.5 million pounds of lead, and 24.5 million to 26.7 million pounds of zinc. Fiscal 2021 production guidance represents an increase of approximately 2% to 7% in silver production, 2% to 5% in lead production, and 12% to 22% in zinc production compared to the current Fiscal 2020 annual guidance.
The Company has been consistently active exploring its existing mining permit areas through drilling and tunneling, with the objective of replacing the ore depleted annually. In recent years, the Company has embarked on a capital investment program at both of its mining operations with the objective of adding facilities and infrastructure that will enhance the efficiency and future profitability of the mines. This program includes the excavation of additional access ramps and tunnels which are expected to facilitate the efficient movement of ore, equipment and personnel within the mines, as well as provide access to new areas of mineralization that may be suitable for mining in current and future periods. Depending on the extent of each project and the rate of development progress, the spending associated with these projects may be spread across several reporting periods until they are complete.
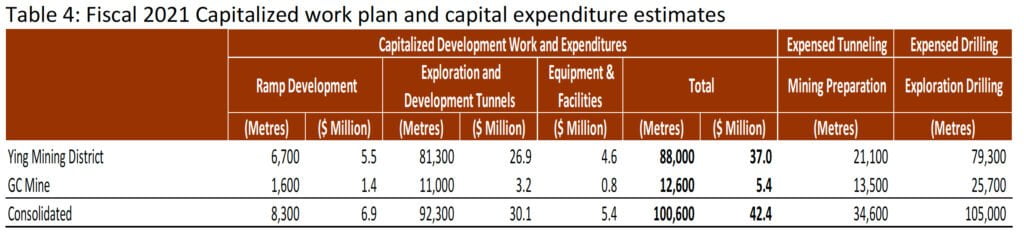
For Fiscal 2021, the Company plans to i) complete 8,300 metres of ramp development tunneling at estimated capitalized expenditures of $6.9 million, representing a 43% increase in meterage and a 15% increase in total cost compared to Fiscal 2020 guidance; ii) complete 92,300 metres of exploration and other development tunneling at estimated capitalized expenditures of $30.1 million, representing a 52% increase in meterage and a 44% increase in total cost compared to Fiscal 2020 guidance, and iii) spend $5.4 million on equipment and facilities, a decrease of 46% compared to Fiscal 2020 guidance. The total capital expenditures are budgeted at $42.4 million, representing an increase of 15% compared to Fiscal 2020 annual guidance. The Company also plans to complete and expense 34,600 metres of mining preparation tunneling and 105,000 metres of diamond drilling. The table below summarizes the work plan and estimated capital expenditures in Fiscal 2021.
(a) Ying Mining District
In Fiscal 2021, the Company plans to mine and process 640,000 to 660,000 tonnes of ore at the Ying Mining District averaging 292 g/t silver, 4.3% lead, and 0.9% zinc with expected metal production of 5.6 million to 5.8 million ounces of silver, 56.6 million to 58.0 million pounds of lead, and 7.0 million to 8.0 million pounds of zinc. Fiscal 2021 production guidance at the Ying Mining District represents an increase of approximately 2% to 5% in silver production, 1% to 3% in lead production, and 11% to 27% in zinc production compared to its Fiscal 2020 annual guidance.
The cash production costs are expected to be $74.7 to $82.5 per tonne of ore, and the all-in sustaining costs are estimated at $133.5 to $140.5 per tonne of ore processed.
In Fiscal 2021, the Ying Mining District plans to i) complete 6,700 metres of ramp development tunneling at estimated capital expenditures of $5.5 million, representing a 57% increase in meterage and 25% increase in total cost compared to its Fiscal 2020 guidance; ii) complete 81,300 metres of exploration and other development tunneling at estimated capital expenditures of $26.9 million, representing a 35% increase in meterage and 35% in total cost compared to its Fiscal 2020 guidance; and iii) spend $4.6 million on equipment and facilities, a decrease of 37% compared to its Fiscal 2020 guidance. The total capital expenditures at the Ying Mining District are budgeted at $37.0 million, an increase of 17% compared to its Fiscal 2020 guidance. The Ying Mining District also plans to complete and expense 21,100 metres of mining preparation tunneling and 79,300 metres of diamond drilling.
(b) GC Mine
In Fiscal 2021, the Company plans to mine and process 290,000 to 310,000 tonnes of ore at the GC Mine averaging 96 g/t silver, 1.7% lead, and 3.3% zinc with expected metal production of 0.6 million to 0.7 million ounces of silver, 9.5 million to 10.5 million pounds of lead and 17.5 million to 18.7 million pounds of zinc. Fiscal 2021 production guidance at the GC Mine represents an increase of approximately 7% to 15% in ore production, 0% to 17% in silver production, 7% to 18% in lead production, and 13% to 21% in zinc production compared to its Fiscal 2020 annual guidance.
The cash production costs are expected to be $52.2 to $57.5 per tonne of ore, and the all-in sustaining costs are estimated at $78.5 to $82.9 per tonne of ore processed.
In Fiscal 2021, the GC Mine plans to i) complete 1,600 metres of ramp development tunneling at estimated capital expenditures of $1.4 million, an increase of 4% in meterage and a decrease of 13% in total cost compared to its Fiscal 2020 guidance; ii) complete 11,000 metres exploration and development tunneling at estimated capital expenditures of $3.2 million, an increase of 1438% in meterage and 254% in total cost; and iii) spend $0.8 million on equipment and facilities, a decrease of 70% compared to its Fiscal 2020 guidance. The total capital expenditures at the GC Mine are budgeted at $5.4 million, an increase of 4% compared to its Fiscal 2020 guidance. The GC Mine also plans to complete and expense 13,500 metres of mining preparation tunneling and 25,700 metres of diamond drilling. Mr. Guoliang Ma, P.Geo., Manager of Exploration and Resources of the Company, is the Qualified Person for Silvercorp under NI 43-101 and has reviewed and given consent to the technical information contained in this news release.
This earnings release should be read in conjunction with the Company’s Management Discussion & Analysis, Financial Statements and Notes to Financial Statements for the corresponding period, which have been posted on SEDAR under the Company’s profile at www.sedar.com and are also available on the Company’s website at www.silvercorp.ca.
About Silvercorp
Silvercorp is a profitable Canadian mining company producing silver, lead and zinc metals in concentrates from mines in China. The Company’s goal is to continuously create healthy returns to shareholders through efficient management, organic growth and the acquisition of profitable projects. Silvercorp balances profitability, social and environmental relationships, employees’ wellbeing, and sustainable development. For more information, please visit our website at www.silvercorp.ca.
For further information
Silvercorp Metals Inc.
Lon Shaver
Vice President
Phone: (604) 669-9397
Toll Free 1(888) 224-1881
Email: [email protected]
Website: www.silvercorp.ca
CAUTIONARY DISCLAIMER – FORWARD-LOOKING STATEMENTS
Certain of the statements and information in this news release constitute “forward-looking statements” within the meaning of the United States Private Securities Litigation Reform Act of 1995 and “forward-looking information” within the meaning of applicable Canadian provincial securities laws (collectively, “forward-looking statements”). Any statements or information that express or involve discussions with respect to predictions, expectations, beliefs, plans, projections, objectives, assumptions or future events or performance (often, but not always, using words or phrases such as “expects”, “is expected”, “anticipates”, “believes”, “plans”, “projects”, “estimates”, “assumes”, “intends”, “strategies”, “targets”, “goals”, “forecasts”, “objectives”, “budgets”, “schedules”, “potential” or variations thereof or stating that certain actions, events or results “may”, “could”, “would”, “might” or “will” be taken, occur or be achieved, or the negative of any of these terms and similar expressions) are not statements of historical fact and may be forward-looking statements. Forward-looking statements relate to, among other things: the price of silver and other metals; the accuracy of mineral resource and mineral reserve estimates at the Company’s material properties; the sufficiency of the Company’s capital to finance the Company’s operations; estimates of the Company’s revenues and capital expenditures; estimated production from the Company’s mines in the Ying Mining District and the GC Mine; timing of receipt of permits and regulatory approvals; availability of funds from production to finance the Company’s operations; and access to and availability of funding for future construction, use of proceeds from any financing and development of the Company’s properties.
Forward-looking statements are subject to a variety of known and unknown risks, uncertainties and other factors that could cause actual events or results to differ from those reflected in the forward-looking statements, including, without limitation, risks relating to: fluctuating commodity prices; calculation of resources, reserves and mineralization and precious and base metal recovery; interpretations and assumptions of mineral resource and mineral reserve estimates; exploration and development programs; feasibility and engineering reports; permits and licences; title to properties; property interests; joint venture partners; acquisition of commercially mineable mineral rights; financing; recent market events and conditions; economic factors affecting the Company; timing, estimated amount, capital and operating expenditures and economic returns of future production; integration of future acquisitions into the Company’s existing operations; competition; operations and political conditions; regulatory environment in China and Canada; environmental risks; foreign exchange rate fluctuations; insurance; risks and hazards of mining operations; key personnel; conflicts of interest; dependence on management; internal control over financial reporting; and bringing actions and enforcing judgments under U.S. securities laws.
This list is not exhaustive of the factors that may affect any of the Company’s forward-looking statements. Forward-looking statements are statements about the future and are inherently uncertain, and actual achievements of the Company or other future events or conditions may differ materially from those reflected in the forward-looking statements due to a variety of risks, uncertainties and other factors, including, without limitation, those referred to in the Company’s Annual Information Form under the heading “Risk Factors”. Although the Company has attempted to identify important factors that could cause actual results to differ materially, there may be other factors that cause results not to be as anticipated, estimated, described or intended. Accordingly, readers should not place undue reliance on forward-looking statements.
The Company’s forward-looking statements are based on the assumptions, beliefs, expectations and opinions of management as of the date of this news release, and other than as required by applicable securities laws, the Company does not assume any obligation to update forward-looking statements if circumstances or management’s assumptions, beliefs, expectations or opinions should change, or changes in any other events affecting such statements. For the reasons set forth above, investors should not place undue reliance on forward-looking statements.
1 Non-IFRS measure. Please refer to section 11 of the corresponding MD&A for reconciliation.