VANCOUVER, British Columbia – August 7, 2019 – Silvercorp Metals Inc. (“Silvercorp” or the “Company”) (TSX/NYSE American: SVM) reported its financial and operating results for the first quarter ended June 30, 2019 (“Q1 Fiscal 2020”). All amounts are expressed in US Dollars.
Q1 FISCAL YEAR 2020 HIGHLIGHTS
- Ore production up 9% compared to the prior year quarter;
- Silver produced and sold up 27% to approximately 1.9 million ounces, gold produced and sold up 43% to 1,000 ounces, lead produced and sold up 20% to 17.8 million pounds, and zinc produced and sold up 15% to 7.3 million pounds, compared to the prior year quarter;
- Revenue up 1% to $45.6 million compared to $45.1 million in the prior year quarter, primarily due to the increase in metals sold and offset by 6% decrease in silver, 25% decrease in lead, and 40% decrease in zinc realized selling prices;
- Net income attributable to equity shareholders of $12.6 million, or $0.07 per share, compared to $10.9 million or $0.06 per share in the prior year quarter;
- Cash production cost per tonne of ore processed1 of $68.85, compared to $69.05 in the prior year quarter;
- Cash cost per ounce of silver1, net of by-product credits, of negative $2.17, compared to negative $7.54 in the prior year quarter;
- All-in sustaining cost per ounce of silver1, net of by-product credits, of $5.69, compared to $0.41 in the prior year quarter;
- Cash flow from operations of $19.9 million, compared to $21.1 million in the prior year quarter;
- Paid dividend of $2.1 million, or $0.0125 per share, to equity shareholders; and,
- Strong balance sheet with $121.0 million in cash and cash equivalents and short-term investments, an increase of $5.7 million or 5% compared to March 31, 2019.
FINANCIALS
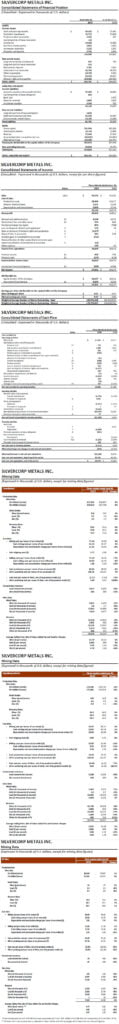
Net income attributable to equity shareholders of the Company in Q1 Fiscal 2020 was $12.6 million, or $0.07 per share, compared to $10.9 million, or $0.06 per share in the three months ended June 30, 2018 (“Q1 Fiscal 2019”).
In Q1 Fiscal 2020, the Company’s financial results were mainly impacted by the following: i) an increase of 27%, 20%, and 15% in amount of silver, lead, and zinc metals sold, respectively; offset by ii) a decrease of 6%, 25% and 40% in the net realized selling price for silver, lead and zinc.
Sales in Q1 Fiscal 2020 were $45.6 million, up 1% compared to $45.1 million in the prior year quarter. Silver, gold and base metal sales represented $23.6 million, $1.1 million, and $20.9 million, respectively, compared to silver, gold and base metals sales of $19.8 million, $0.7 million, and $24.6 million, respectively, in the prior year quarter. The increase of volume of metals sold resulted in an increase of approximately $8.9 million in revenue, while the decrease of net realized selling prices resulted in a decrease of approximately $8.4 million in revenue in the current quarter.
Cost of sales in Q1 Fiscal 2020 was $25.1 million compared to $20.3 million in Q1 Fiscal 2019. The cost of sales included $18.0 million cash production costs (Q1 Fiscal 2019 – $14.3 million), $1.3 million mineral resources tax (Q1 Fiscal 2019 – $1.2 million), and $5.9 million depreciation and amortization charges (Q1 Fiscal 2019 – $4.7 million). The increases in cash production costs and depreciation and amortization expensed were mainly due to more metals sold. The increase in mineral resources tax was associated with the increase in revenue.
Gross profit margin in Q1 Fiscal 2020 of 45%, compared to 55% in Q1 Fiscal 2019. Ying Mining District’s gross profit margin was 48% compared to 59% in the prior year quarter, while GC Mine’s gross profit margin was 31% compared to 39% in the prior year quarter. The decrease of gross margin was mainly due to the decrease in metal prices.
General and administrative expenses in Q1 Fiscal 2020 were $4.5 million, compared to $4.5 million in Q1 Fiscal 2019.
Income tax recovery in Q1 Fiscal 2020 was $0.5 million compared to an income tax expense of $6.5 million in Q1 Fiscal 2019. In Q1 Fiscal 2020, the Company recorded current income tax expenses of $1.8 million (Q1 Fiscal 2019 – $5.9 million), and a deferred income tax recovery of $2.2 million (Q1 Fiscal 2019 – expense of $0.5 million). The deferred income tax recovery was mainly related to the tax benefit recognized arising from the disposal of the XHP Project.
Cash flows provided by operating activities in Q1 Fiscal 2020 were $19.9 million, slightly lower than the $21.1 million in Q1 Fiscal 2019.
The Company ended the quarter with $121.0 million in cash and cash equivalents and short-term investments, an increase of $5.7 million or 5% compared to $115.3 million as at March 31, 2019.
Working capital as at June 30, 2019 was $110.8 million, an increase of $13.8 million or 14%, compared to $96.9 million working capital as at March 31, 2019.
OPERATIONS AND DEVELOPMENT
In Q1 Fiscal 2020, on a consolidated basis, the Company mined 257,392 tonnes of ore, an increase of 9% compared to 236,697 tonnes in Q1 Fiscal 2019. The increase in ore mined was mainly due to an increase of 13% or 19,854 tonnes of ore mined at the Ying Mining District. Correspondingly, ore milled also increased by 9% to 259,542 tonnes, compared to 237,740 tonnes in Q1 Fiscal 2019.
In Q1 Fiscal 2020, the Company sold 1.9 million ounces of silver, 1,000 ounces of gold, 17.8 million pounds of lead, and 7.3 million pounds of zinc, up 27%, 43%, 20%, and 15%, respectively, compared to 1.5 million ounces of silver, 700 ounces of gold, 14.9 million pounds of lead, and 6.3 million pounds of zinc in Q1 Fiscal 2019. As at June 30, 2019, the Company had inventories of 4,247 tonnes of silver-lead concentrate and 285 tonnes of zinc concentrate, compared to 3,248 tonnes of silver-lead concentrate and 368 tonnes of zinc concentrate as at March 31, 2019.
In Q1 Fiscal 2020, the consolidated total mining and cash mining costs were $77.40 and $55.45 per tonne, up 4% and 2% compared to $74.39 and $54.47 per tonne, respectively in Q1 Fiscal 2019. The increase in cash mining costs was mainly due to i) an overall 3% increase in the mining contractors’ rate when two-year term mining contracts renewed at the Ying Mining District in the current quarter, and ii) more ore mined using resuing mining method at the GC Mine. The consolidated total milling and cash milling costs in Q1 Fiscal 2020 were $12.49 and $10.63 per tonne, down by 12% and 9% compared to $14.16 and $11.73 per tonne, respectively, in Q1 Fiscal 2019.
Correspondingly, the consolidated cash production cost per tonne of ore processed in Q1 Fiscal 2020 was $68.85, a slight decrease compared to $69.05 in the prior year quarter, and below the Company’s Fiscal 2020 annual guidance of $$71.80.
In Q1 Fiscal 2020, the consolidated cash cost per ounce of silver, net of by-product credits, was negative $2.17, compared to negative $7.54, in the prior year quarter. The increase in cash cost per ounce of silver, net of by-product credits, was mainly due to a decrease of $5.42 per ounce of silver in by-product credits resulting from lower by-product metal prices and more volume of silver sold. The consolidated all-in sustaining cost per ounce of silver, net of by-product credits, was $5.69 compared to $0.41 in Q1 Fiscal 2019. The increase was mainly due to i) the increase of cash cost per ounce of silver, net of by-product credits as discussed above, and ii) a $3.0 million increase in sustaining capital expenditures.
In Q1 Fiscal 2020, on a consolidated basis, approximately 31,618 metres or $0.9 million worth of diamond drilling (Q1 Fiscal 2019 – 34,848 metres or $1.0 million) and 12,656 metres or $3.1 million worth of preparation tunnelling (Q1 Fiscal 2019 – 10,782 metres or $3.2 million) were completed and expensed as mining preparation costs. In addition, approximately 21,392 metres or $7.4 million worth of horizontal tunnels, raises, ramps and declines (Q1 Fiscal 2019 – 17,466 metres or $6.5 million) were completed and capitalized.
1. Ying Mining District, Henan Province, China
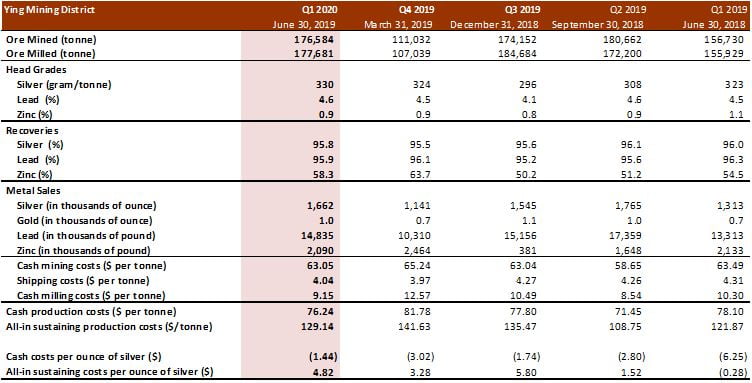
In Q1 Fiscal 2020, the total ore mined at the Ying Mining District was 176,584 tonnes, up 13% compared to 156,730 tonnes mined in the prior year quarter. Ore milled was 177,681 tonnes, up 14% compared to 155,929 tonnes in Q1 Fiscal 2019.
Head grades were 330 grams per ton (“g/t”) for silver, 4.6% for lead, and 0.9% for zinc, compared to 323 g/t for silver, 4.5% for lead, and 1.1% for zinc in the prior year quarter. The Company continues to achieve improvements in dilution control using its “Enterprise Blog” to assist and manage daily operations.
In Q1 Fiscal 2020, the Ying Mining District sold approximately 1.7 million ounces of silver, 14.8 million pounds of lead, and 2.1 million pounds of zinc, compared to 1.3 million ounces of silver, 13.3 million pounds of lead, and 2.1 million pounds of zinc in the prior year quarter. As at June 30, 2019, Ying Mining District had inventories of 4,208 tonnes of silver-lead concentrate and 200 tonnes of zinc concentrate, compared to 3,150 tonnes of silver-lead concentrate and 250 tonnes of zinc concentrate as at March 31, 2019.
Total and cash mining costs per tonne at the Ying Mining District in Q1 Fiscal 2020 were $91.47 and $63.05 per tonne, respectively, compared to $89.57 and $63.49 per tonne in the prior year quarter. The decrease in the per tonne cash mining cost was mainly due to i) lower per tonne fixed costs allocation resulting from the increase in ore mined, offset by ii) an overall 3% increase in mining contractors’ rate when the two-year term mining contracts were renewed in the current quarter.
Total and cash milling costs per tonne at the Ying Mining District in Q1 Fiscal 2020 were $10.93 and $9.15, compared to $12.60 and $10.30 in Q1 Fiscal 2019. The decrease of per tonne milling costs was mainly due to lower per tonne fixed costs allocation resulting from the increase in ore milled.
Correspondingly, the cash production cost per tonne of ore processed in Q1 Fiscal 2020 at the Ying Mining District was $76.24, compared to $78.10 in the prior year quarter.
Cash cost per ounce of silver, net of by-product credits, in Q1 Fiscal 2020 at the Ying Mining District, was negative $1.44 compared to negative $6.25 in the prior year quarter. The increase was mainly due to a decrease of $4.53 per ounce of silver in by-product credits resulting from the decrease in metal prices and more silver sold. All-in sustaining cost per ounce of silver, net of by-product credits, in Q1 Fiscal 2020 at the Ying Mining District was $4.82 compared to negative $0.28 in the prior year quarter. The increase was mainly due to higher cash cost per ounce of silver, net of by-product credits and an increase of $2.5 million in sustaining capital expenditures.
In Q1 Fiscal 2020, approximately 23,648 metres or $0.6 million worth of diamond drilling (Q1 Fiscal 2019 – 26,849 metres or $0.6 million) and 6,395 metres or $1.7 million worth of preparation tunnelling (Q1 Fiscal 2019 – 5,541 metres or $1.6 million) were completed and expensed as mining preparation costs at the Ying Mining District. In addition, approximately 20,895 metres or $7.1 million worth of horizontal tunnels, raises, ramps and declines (Q1 Fiscal 2019 – 16,928 metres or $6.0 million) were completed and capitalized.
2. GC Mine, Guangdong Province, China
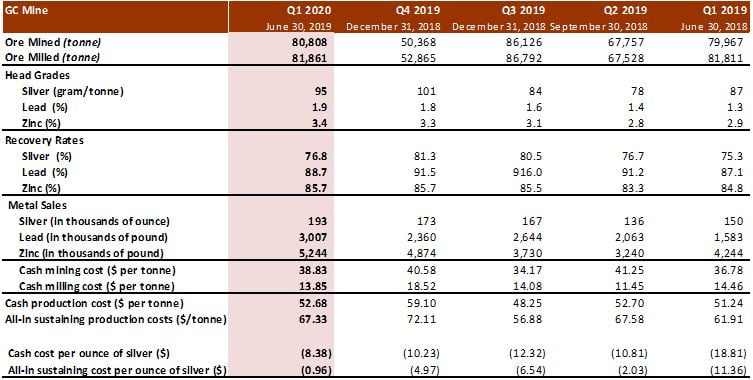
In Q1 Fiscal 2020, the total ore mined at the GC Mine was 80,808 tonnes compared to 79,967 tonnes in the prior year quarter. Ore milled was 81,861 tonnes compared to 81,811 tonnes in the prior year quarter.
Average head grades of ore processed at the GC Mine were 95 g/t for silver, 1.9% for lead, and 3.4% for zinc, compared to 87 g/t for silver, 1.3% for lead, and 2.9% for zinc in the prior year quarter. Recovery rates of ore processed were 76.8% for silver, 88.7% for lead, and 85.7% for zinc, compared to 75.3% for silver, 87.1% for lead, and 84.8% for zinc in Q1 Fiscal 2019.
In Q1 Fiscal 2020, GC Mine sold approximately 193,000 ounces of silver, 3.0 million pounds of lead, and 5.2 million pounds of zinc, compared to 150,000 thousand ounces of silver, 1.6 million pounds of lead, and 4.2 million pounds of zinc in the prior year quarter.
Total and cash mining costs per tonne at the GC Mine in Q1 Fiscal 2020 were $46.64 and $38.83 per tonne, an increase of 5% and 6% respectively, compared to $44.62 and $36.78 per tonne, respectively, in Q1 Fiscal 2019. The increase in the cash mining cost was mainly due to an increase of $2.63 per tonne in mining contractors’ cost resulting from more ore mined using re-suing mining method. Total and cash milling cost per tonne at the GC Mine in Q1 Fiscal 2020 were $15.88 and $13.85, a decrease of 7% and 4%, respectively, compared to $17.14 and $14.46, respectively, in Q1 Fiscal 2019.
Correspondingly, the cash production cost per tonne of ore processed in Q1 Fiscal 2020 at the GC Mine was $52.68, an increase of 3% compared to $51.24 in the prior year quarter.
Cash cost per ounce of silver, net of by-product credits, at the GC Mine, was negative $8.38 compared to negative $18.81 in the prior year quarter. The increase was mainly due to a decrease of $13.61 per ounce of silver in by-product credits resulting from the decrease in metal prices and more silver sold. All-in sustaining cost per ounce of silver, net of by-product credits, in Q1 Fiscal 2020 at the GC Mine was negative $0.96 compared to negative $11.36 in the prior year quarter. The increase was mainly due to the increase in the cash cost per ounce of silver, net of by-product credits, as discussed above.
In Q1 Fiscal 2020, approximately 7,970 metres or $0.3 million worth of underground diamond drilling (Q1 Fiscal 2019 – 7,999 metres or $0.4 million) and 6,261 metres or $1.4 million worth of tunnelling (Q1 Fiscal 2019 – 5,241 metres or $1.6 million) were completed and expensed as mining preparation costs at the GC Mine. In addition, approximately 497 metres or $0.3 million worth of horizontal tunnels, raises, ramps and declines (Q1 Fiscal 2019 – 538 metres or $0.5 million) were completed and capitalized.
3. XHP Project, Henan Province, China
In April 2019, Henan Found, the Company’s 77.5% owned subsidiary, entered into a share transfer agreement (the “Agreement”) with an arm’s-length private Chinese company to dispose of the XHP Project. Pursuant to the Agreement, Henan Found sold its 100% equity interest in SX Gold, the holding company of the XHP Project, for $7.3 million (RMB ¥50 million), and forgave the amount of $1.1 million (RMB ¥7.5 million ) SX Gold owes to Henan Found. The transaction was completed and a gain of $1.5 million was recognized in Q1 Fiscal 2020.
Mr. Guoliang Ma, P.Geo., Manager of Exploration and Resources of the Company, is the Qualified Person as defined by National Instrument 43-101 – Standards of Disclosure for Mineral Projects (“NI 43-101”) and has reviewed and given consent to the technical information contained in this news release.
This earnings release should be read in conjunction with the Company’s Management Discussion & Analysis, Financial Statements and Notes to Financial Statements for the corresponding period, which have been posted on SEDAR under the Company’s profile at www.sedar.com and are also available on the Company’s website at www.silvercorp.ca.
About Silvercorp
Silvercorp is a profitable Canadian mining company producing silver, lead and zinc metals in concentrates from mines in China. The Company’s goal is to continuously create healthy returns to shareholders through efficient management, organic growth and the acquisition of profitable projects. Silvercorp balances profitability, social and environmental relationships, employees’ wellbeing, and sustainable development. For more information, please visit our website at www.silvercorp.ca.
For further information
Silvercorp Metals Inc.
Lon Shaver
Vice President
Phone: (604) 669-9397
Toll Free 1(888) 224-1881
Email: [email protected]
Website: www.silvercorp.ca
CAUTIONARY DISCLAIMER – FORWARD-LOOKING STATEMENTS
Certain of the statements and information in this news release constitute “forward-looking statements” within the meaning of the United States Private Securities Litigation Reform Act of 1995 and “forward-looking information” within the meaning of applicable Canadian provincial securities laws (collectively, “forward-looking statements”). Any statements or information that express or involve discussions with respect to predictions, expectations, beliefs, plans, projections, objectives, assumptions or future events or performance (often, but not always, using words or phrases such as “expects”, “is expected”, “anticipates”, “believes”, “plans”, “projects”, “estimates”, “assumes”, “intends”, “strategies”, “targets”, “goals”, “forecasts”, “objectives”, “budgets”, “schedules”, “potential” or variations thereof or stating that certain actions, events or results “may”, “could”, “would”, “might” or “will” be taken, occur or be achieved, or the negative of any of these terms and similar expressions) are not statements of historical fact and may be forward-looking statements. Forward-looking statements relate to, among other things: the price of silver and other metals; the accuracy of mineral resource and mineral reserve estimates at the Company’s material properties; the sufficiency of the Company’s capital to finance the Company’s operations; estimates of the Company’s revenues and capital expenditures; estimated production from the Company’s mines in the Ying Mining District and the GC Mine; timing of receipt of permits and regulatory approvals; availability of funds from production to finance the Company’s operations; and access to and availability of funding for future construction, use of proceeds from any financing and development of the Company’s properties.
Forward-looking statements are subject to a variety of known and unknown risks, uncertainties and other factors that could cause actual events or results to differ from those reflected in the forward-looking statements, including, without limitation, risks relating to: fluctuating commodity prices; calculation of resources, reserves and mineralization and precious and base metal recovery; interpretations and assumptions of mineral resource and mineral reserve estimates; exploration and development programs; feasibility and engineering reports; permits and licences; title to properties; property interests; joint venture partners; acquisition of commercially mineable mineral rights; financing; recent market events and conditions; economic factors affecting the Company; timing, estimated amount, capital and operating expenditures and economic returns of future production; integration of future acquisitions into the Company’s existing operations; competition; operations and political conditions; regulatory environment in China and Canada; environmental risks; foreign exchange rate fluctuations; insurance; risks and hazards of mining operations; key personnel; conflicts of interest; dependence on management; internal control over financial reporting; and bringing actions and enforcing judgments under U.S. securities laws.
This list is not exhaustive of the factors that may affect any of the Company’s forward-looking statements. Forward-looking statements are statements about the future and are inherently uncertain, and actual achievements of the Company or other future events or conditions may differ materially from those reflected in the forward-looking statements due to a variety of risks, uncertainties and other factors, including, without limitation, those referred to in the Company’s Annual Information Form under the heading “Risk Factors”. Although the Company has attempted to identify important factors that could cause actual results to differ materially, there may be other factors that cause results not to be as anticipated, estimated, described or intended. Accordingly, readers should not place undue reliance on forward-looking statements.
The Company’s forward-looking statements are based on the assumptions, beliefs, expectations and opinions of management as of the date of this news release, and other than as required by applicable securities laws, the Company does not assume any obligation to update forward-looking statements if circumstances or management’s assumptions, beliefs, expectations or opinions should change, or changes in any other events affecting such statements. For the reasons set forth above, investors should not place undue reliance on forward-looking statements.