VANCOUVER, British Columbia – November 12, 2015 – Silvercorp Metals Inc. (“Silvercorp” or the “Company”) (TSX: SVM) reported its financial and operating results for the second quarter ended September 30, 2015 (“Q2 Fiscal 2016”). All amounts are expressed in US Dollars.
SECOND QUARTER HIGHLIGHTS
- Cash flows from operations of $4.6 million, or $0.03 per share;
- Repurchased 1,638,252 common shares of the Company;
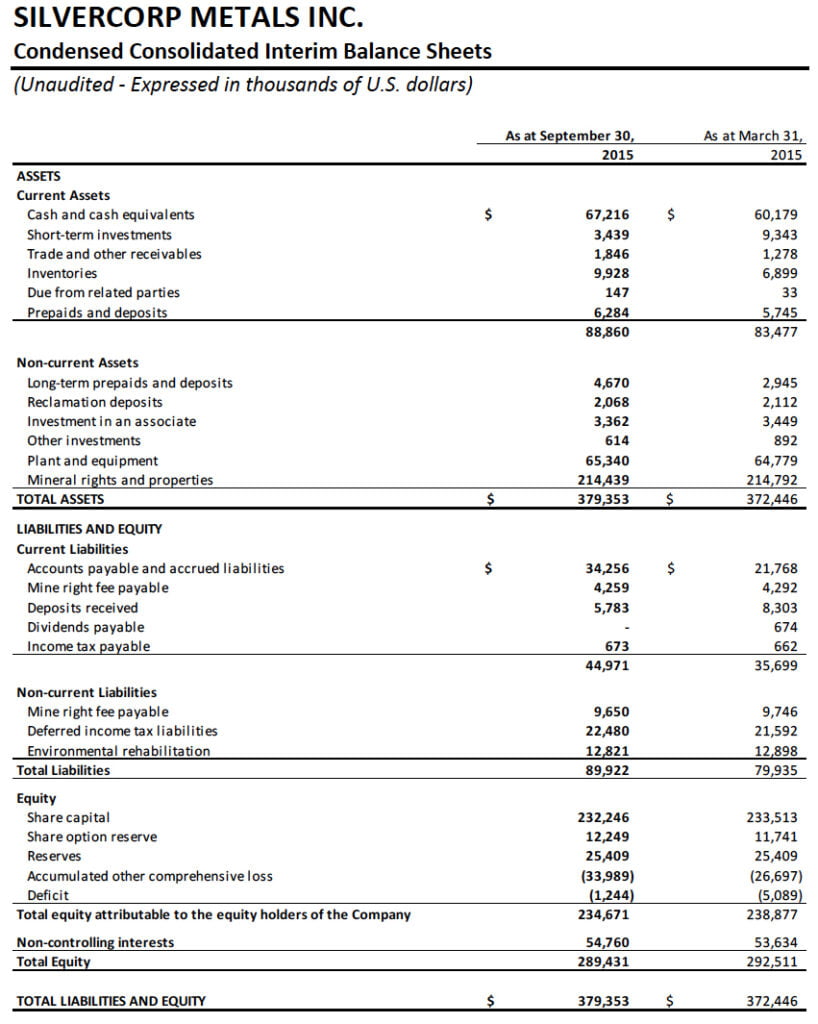
- Ended the quarter with $70.7 million in cash and short term investments;
- Net income attributable to equity shareholders of $2.2 million, or $0.01 per share;
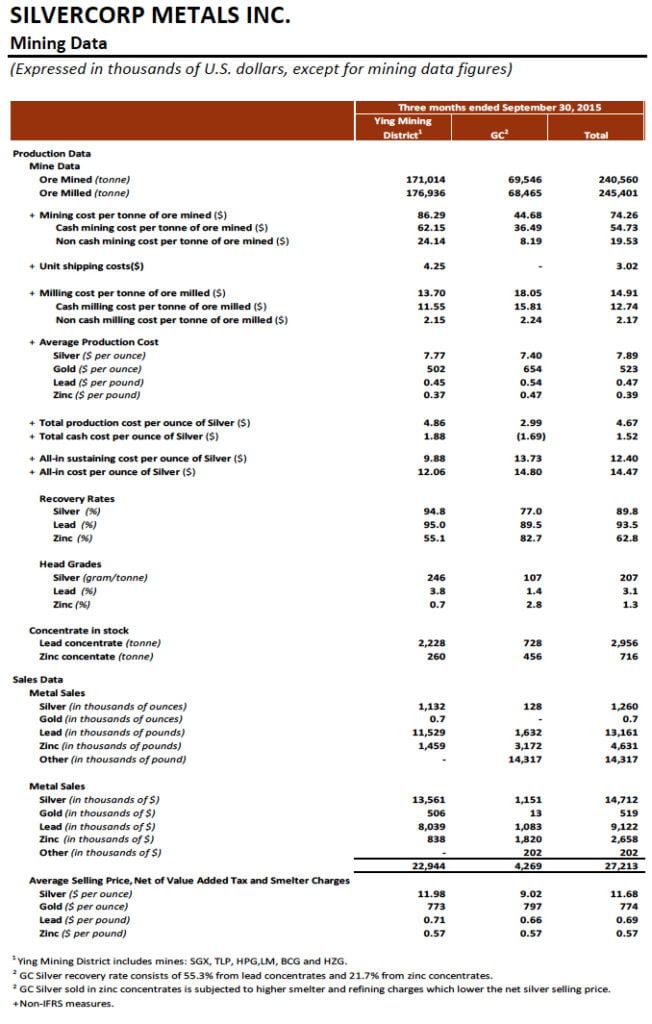
- Silver sales of 1.3 million ounces, lead sales of 13.2 million pounds, and zinc sales of 4.6 million pounds, down 7%, 7%, and 11%, respectively, from the prior year quarter;
- Realized selling price for silver, lead, and zinc at the Ying Mining District dropped by 26%, 8%, and 19%, respectively, compared to the same prior year quarter;
- Sales of $27.2 million, down 27% from the prior year quarter;
- Significant increase of silver-lead concentrate inventory from 430 tonnes to 2,228 tonnes (containing approximately 0.2 million ounces of silver and 2.0 million pounds of lead) at the Ying Mining District, compared to the prior year quarter;
- Gross margin of 32% compared with 49% in the prior year period;
- Cash cost per ounce of silver, net of by-product credits, of $1.52, compared to negative $0.98 in the prior year quarter; and
- All-in sustaining cost per ounce of silver, net of by-product credits, of $12.40, compared to $9.68 in the prior year quarter.
FINANCIALS
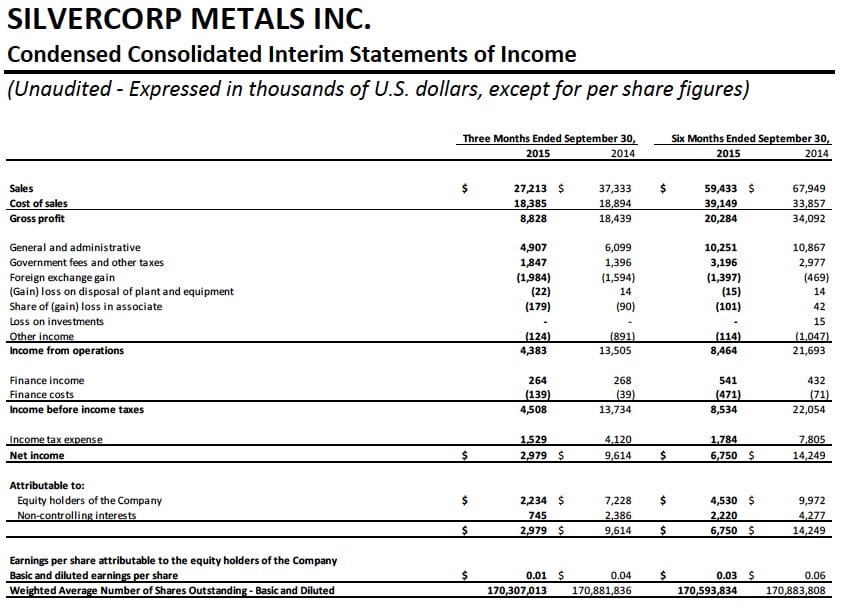
Net income attributable to the shareholders of the Company in Q2 Fiscal 2016 was $2.2 million, or $0.01 per share compared to $7.2 million, or $0.04 per share for the three months ended September 30, 2014 (“Q2 Fiscal 2015”).
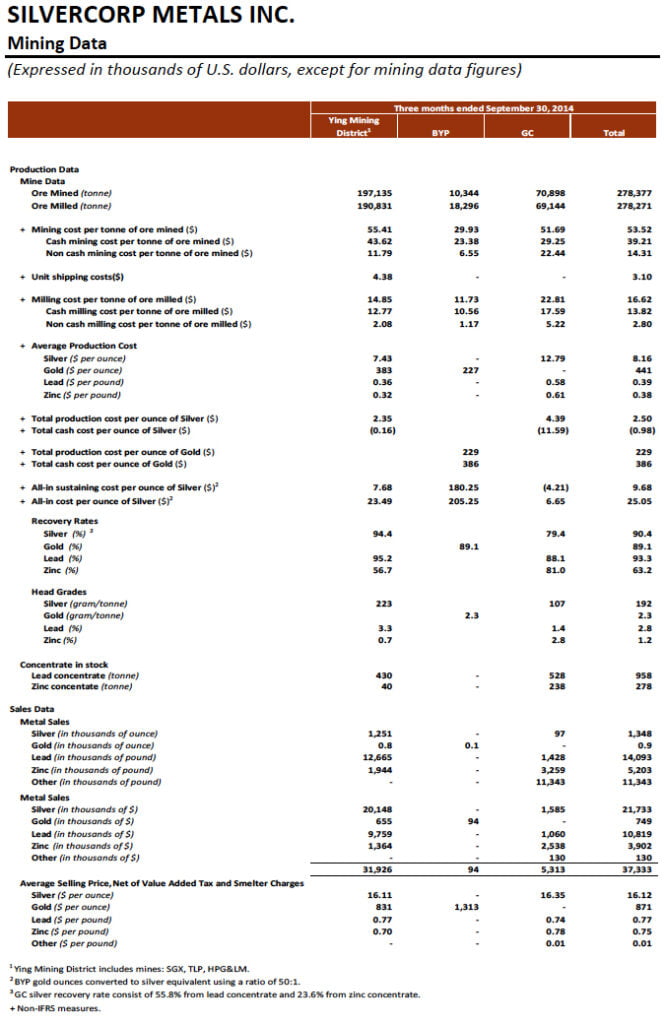
In the current quarter, the Company’s financial results were mainly impacted by the following: i) lower metal prices, as the realized selling price for silver, lead, and zinc at the Ying Mining District dropped by 26%, 8%, and 19%, respectively, compared to the same prior year quarter, ii) lower gold production and sales as operations at BYP mine have been suspended since August 2014; iii) higher production costs; and iv) lower amount of metals sold as increase in silver-lead and zinc concentrate inventory.
Sales in Q2 Fiscal 2016 were $27.2 million compared to $37.3 million in Q2 Fiscal 2015. Silver and gold sales represented $14.7 million and $0.5 million, respectively, while base metals represented $12.0 million of total sales in this quarter compared to silver, gold and base metal sales of $21.7 million, $0.7 million, and $14.9 million, respectively, in Q2 Fiscal 2015.
Cost of sales in Q2 Fiscal 2016 was $18.4 million compared to $18.9 million in Q2 Fiscal 2015. The cost of sales included $14.4 million (Q2 Fiscal 2015 – $14.2 million) cash costs and $4.0 million (Q2 Fiscal 2015 – $4.7 million) depreciation, amortization and depletion charges. The decrease in cost of sales is mainly due to lower amount of metals sold in the quarter, offset by the increase in per tonne mining production costs.
Gross profit margin in Q2 Fiscal 2016 was 32% compared to 49% in Q2 Fiscal 2015. The decrease in gross profit margin is mainly due to the decline of metal prices, increases in smelter charges, and increased per tonne production costs.
Cash flows provided by operating activities were $4.6 million or $0.03 per share in Q2 Fiscal 2016 compared to $20.1 million or $0.12 per share in Q2 Fiscal 2015.
OPERATIONS AND DEVELOPMENT
In Q2 Fiscal 2016, the Company sold 1.3 million ounces of silver, 13.2 million pounds of lead, and 4.6 million pounds of zinc, compared to 1.3 million ounces of silver, 14.1 million pounds of lead, and 5.2 million pounds of zinc, respectively, in Q2 Fiscal 2015. The decrease of metal sales is mainly due to the Company intentionally increasing its inventory of concentrates in reaction to lower metal prices. As at September 30, 2015, the Ying Mining District had 2,228 tonnes of lead concentrates and 260 tonnes of zinc concentrates in inventory, 1,798 and 220 tonnes higher, respectively, compared to 430 tonnes of lead concentrates and 40 tonnes of zinc concentrates in stock as at September 30, 2014. The estimated metals contained in the concentrates inventory as at September 30, 2015, are approximately 0.2 million ounces of silver, 2.0 million pounds of lead, and 0.2 million pounds of zinc higher, respectively, compared to the metals contained in concentrates inventory as at September 30, 2014.
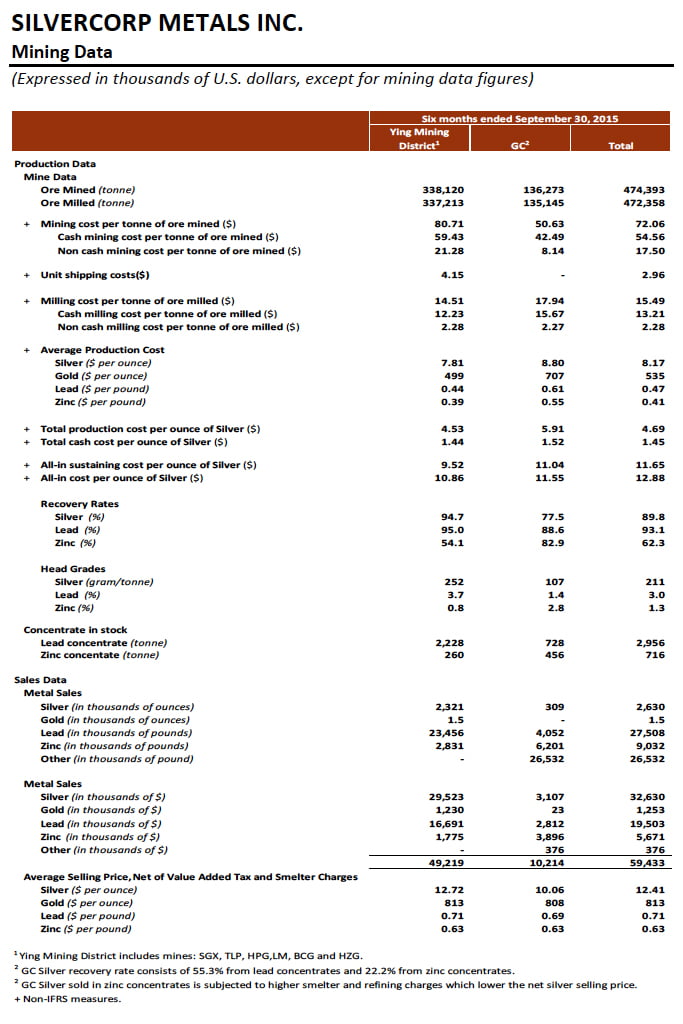
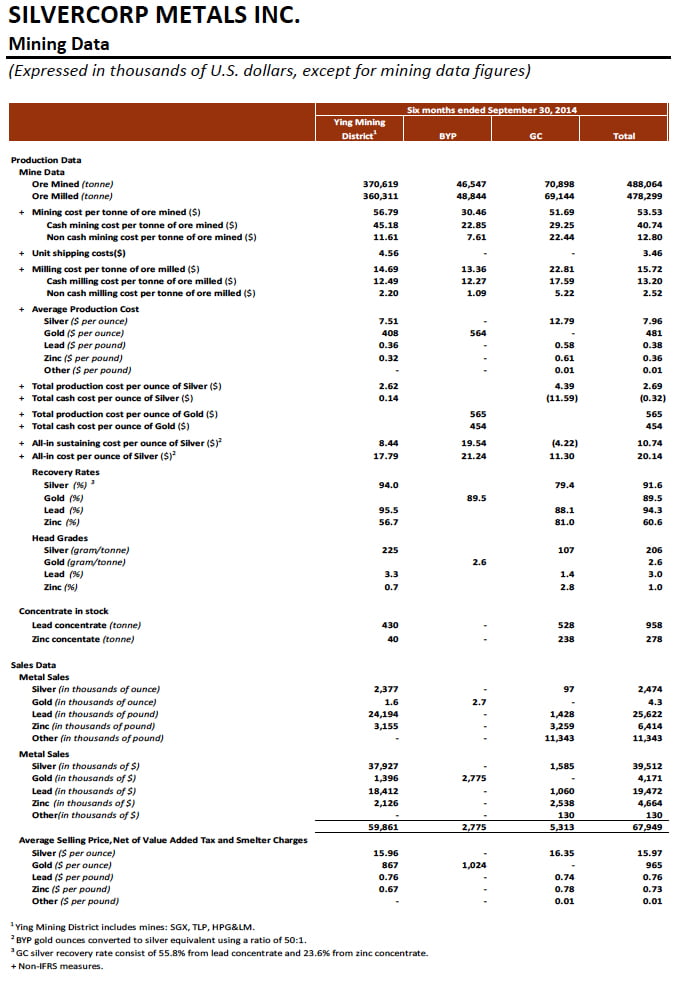
For the six months ended September 30, 2015, the Company sold 2.6 million ounces of silver, 27.5 million pounds of lead, and 9.0 million pounds of zinc, compared to 2.5 million ounces of silver, 25.6 million pounds of lead, and 6.4 million pounds of zinc, respectively, in the same prior year period.
1. Ying Mining District, Henan Province, China
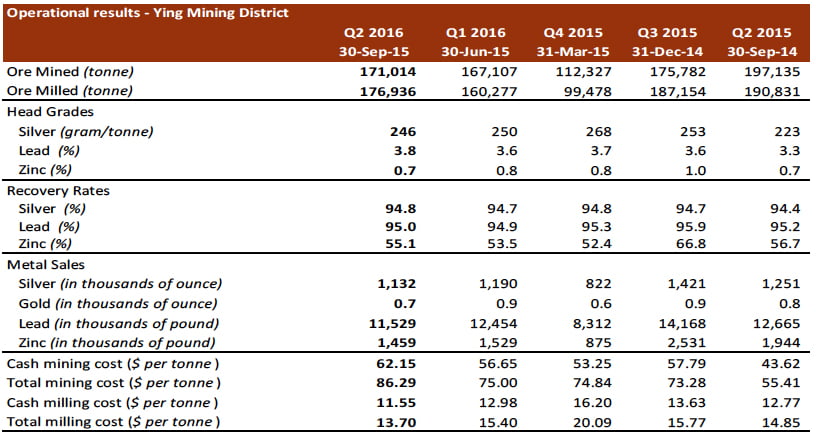
In Q2 Fiscal 2016, the total ore mined at the Ying Mining District was 171,014 tonnes compared to total ore production of 197,135 tonnes in Q2 Fiscal 2015. Silver and lead head grades improved by 10% and 15%, respectively, to 246 grams per tonne (“g/t”) for silver and 3.8% for lead from 223 g/t for silver and 3.3% for lead, respectively, in Q2 Fiscal 2015.
In Q2 Fiscal 2016, the Ying Mining District sold 1.1 million ounces of silver, 700 ounces of gold, 11.5 million pounds of lead, and 1.5 million pounds of zinc, compared to 1.3 million ounces of silver, 788 ounces of gold, 12.7 million pounds of lead, and 1.9 million pounds of zinc in Q2 Fiscal 2015. The decrease of metal sales is mainly due to the Company intentionally increasing its inventory of concentrates in reaction to the low metal prices.
As disclosed in the prior quarter, the mining contractor changeover disruptions have impacted not only the production but also resulted in additional costs at the SGX mine, including approximately $0.5 million in the current quarter and $1.5 million in total. In Q2 Fiscal 2016, the cash mining costs at the Ying Mining District were $10.6 million or $62.15 per tonne, compared to $8.6 million or $43.62 per tonne in Q2 Fiscal 2015. The increase in cash mining costs was mainly due to: i) $0.5 million or $2.6 per tonne arising from the mining contractor changeover interruption; ii) $2.1 million or $14.5 per tonne increase in mining preparation costs as approximately 22,846 metres (“m”) of underground diamond drilling and 6,507 m of preparation tunnelling were conducted in the current quarter, compared to 7,104 m of underground diamond drilling and 4,503 m of preparation tunnelling expensed in Q2 Fiscal 2015; iii) $0.1 million or $0.8 per tonne increase in mine administration costs; offset by iv) $0.3 million or $0.9 per tonne decrease in labour costs and v) $0.2 million decrease in mining contractors’ costs, but lower production output resulting in a higher per tonne costs.
Compared to the cash mining cost of $9.5 million or $56.65 per tonne in Q1 Fiscal 2016, the cash mining cost increased by $1.1 million or $5.50 per tonne in Q2 Fiscal 2016. Excluding the additional costs arising from the mining contractor interruption, the increase in cash mining costs was mainly due to: i) a $1.4 million increase in mining preparation costs as 22,846 m of underground diamond drilling and 6,507 m of preparation tunnelling were completed, and ii) a $0.2 million or $0.6 increase in mining contractors’ costs as more re-suing mining methods were employed.
In Q2 Fiscal 2016, total ore milled at the Ying Mining District was 176,936 tonnes, a decrease of 7% compared to 190,831 tonnes in Q2 Fiscal 2015. Cash milling costs were $2.0 million or $11.55 per tonne, a decrease of $0.4 million or $1.22 per tonne, compared to $2.4 million or $12.77 per tonne in Q2 Fiscal 2015.
All in sustaining costs and all in costs, net of by-product credits, at the Ying Mining District in Q2 2016 was $9.88 and $12.06 per ounce of silver compared to $7.68 and $23.49, respectively, in Q2 Fiscal 2015.
For the six months ended September 30, 2015, the total ore mined at the Ying Mining District was 338,120 tonnes compared to 370,619 tonnes in the same prior year period. Correspondingly, total ore milled was 337,213 tonnes compared to 360,311 tonnes. Head grades were 252 g/t for silver and 3.7% for lead compared to 225 g/t for silver and 3.3% for lead, respectively.
During the same time periods, the Ying Mining District sold 2.3 million ounces of silver, 1,500 ounces of gold, 23.5 million pounds of lead, and 2.8 million pounds of zinc, compared to 2.4 million ounces of silver, 1,610 ounces of gold, 24.2 million pounds of lead, and 3.2 million pounds of zinc in the prior year.
For the six months ended September 30, 2015, the cash mining costs at the Ying Mining District were $20.1 million or $59.43 per tonne, compared to $16.7 million or $45.18 per tonne in the same prior year period. The increase in cash mining costs per tonne was mainly due to: i) a $1.5 million or $4.5 per tonne increase arising from the mining contractor changeover interruption; ii) a $2.4 million or $9.6 per tonne increase in mining preparation costs as approximately 39,212 m of underground diamond drilling and 12,563 m of preparation tunnelling were conducted in the current period, compared to 15,709 m of underground diamond drilling and 9,251 m of preparation tunnelling expensed in the same prior year period, and iii) lower production output resulting in a higher per unit fixed costs allocation.
All in sustaining costs and all in costs, net of by-product credits, at the Ying Mining District for the six months ended September 30, 2015 was $9.52 and $10.86 per ounce of silver compared to $8.44 and $17.79, respectively, in same prior year period.
In Q2 Fiscal 2016, in additional to approximately 22,846 m of underground diamond drilling and 6,507 m of preparation tunnelling, which were expensed and included in the mining preparation costs, Ying Mining District completed and capitalized approximately 17,271 m of horizontal tunnels, raises and declines. Total exploration and development expenditures capitalized for the Ying Mining District were $5.7 million compared to $9.0 million in Q2 Fiscal 2015.
For the six months ended September 30, 2015, in additional to approximately 39,212 m underground diamond drilling and 12,563 m preparation tunnelling, which were expensed and included in the mining preparation costs, Ying Mining District completed and capitalized approximately 35,790 m of horizontal tunnel, raises, and declines. Total exploration and development expenditures capitalized for the Ying Mining District were $11.8 million in the six months ended September 30, 2015 compared to $17.1 million in the same prior year period.
The operational results at the Ying Mining District for the past five quarters are summarized in the table below:
2. GC Mine, Guangdong Province, China
Commercial production at GC mine commenced on July 1, 2014, and the trial mining operation results in Q1 Fiscal 2015 have been excluded from the consolidated operation results discussed above and revenue realized from metal sales during the trial period was offset against costs capitalized.
The operational results at the GC mine for the past five quarters are summarized in the table below:
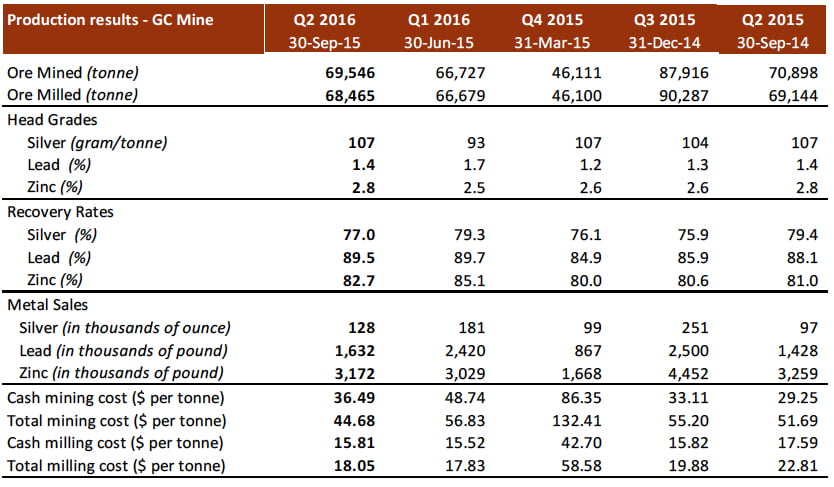
Total ore mined at GC mine in Q2 Fiscal 2016 was 69,546 tonnes at a total mining cost and cash mining cost of $44.68 and $36.49, compared to 70,898 tonnes mined in Q2 Fiscal 2015 at a total mining cost and cash mining cost of $51.69 and $29.25. The increase in cash mining cost was mainly due to $0.6 million or $8.5 per tonne increase in mining preparation cost offset by $0.1 million or $1.7 per tonne in mining contractor’s cost.
Total ore milled at GC mine in Q2 Fiscal 2016 was 68,465 at a total milling cost and cash milling cost of $18.05 and $15.81, compared to 69,144 tonnes milled in Q2 Fiscal 2015 at a total milling cost and cash milling cost of $22.81 and $17.59.
The head grades at GC mine were 107 g/t for silver, 1.4% for lead, and 2.8% for zinc in Q2 Fiscal 2016, which are comparable to the head grades in Q2 Fiscal 2015.
Recovery rates at GC mine were 77% for silver, 89.5% for lead, and 82.7% for zinc in Q2 Fiscal 2016 compared to 79.4% for silver, 88.1% for lead, and 81.0% for zinc, respectively in Q2 Fiscal 2015.
In Q2 Fiscal 2016, in additional to approximately 6,882 m of underground diamond drilling and 677 m of preparation tunnelling, which were expensed and included in the mining preparation costs, GC mine completed and capitalized approximately 3,090 m of horizontal tunnels, raises and declines. Total exploration and development expenditures capitalized at the GC mine were $0.3 million compared to $1.9 million in Q2 Fiscal 2015.
For the six months ended September 30, 2015, in additional to approximately 14,298 m of underground diamond drilling and 1,962 m of preparation tunnelling, which were expensed and included in the mining preparation costs, GC mine completed and capitalized approximately 6,459 m of horizontal tunnel, raises, and declines. Total exploration and development expenditures capitalized at the GC mine were $0.5 million in the six months ended September 30, 2015 compared to $2.3 million in the same prior year period.
Alex Zhang, P.Geo., Vice President, Exploration, is the Qualified Person for Silvercorp under NI 43-101 and has reviewed and given consent to the technical information contained in this news release.
This earnings release should be read in conjunction with the Company’s Management Discussion & Analysis, Financial Statements and Notes to Financial Statements for the corresponding period, which have been posted on SEDAR at www.sedar.comand are also available on the Company’s website at www.silvercorp.ca. All figures are in United States dollars unless otherwise stated.
About Silvercorp
Silvercorp is a low-cost silver-producing Canadian mining company with multiple mines in China. The Company’s vision is to deliver shareholder value by focusing on the acquisition of under developed projects with resource potential and the ability to grow organically. For more information, please visit our website at www.silvercorp.ca.
For further information
Silvercorp Metals Inc.
Lorne Waldman
Senior Vice President
Phone: (604) 669-9397
Toll Free 1(888) 224-1881
Email: investor@silvercorp.ca
Website: www.silvercorp.ca
CAUTIONARY DISCLAIMER – FORWARD LOOKING STATEMENTS
Certain of the statements and information in this press release constitute “forward-looking statements” within the meaning of the United States Private Securities Litigation Reform Act of 1995 and “forward-looking information” within the meaning of applicable Canadian provincial securities laws. Any statements or information that express or involve discussions with respect to predictions, expectations, beliefs, plans, projections, objectives, assumptions or future events or performance (often, but not always, using words or phrases such as “expects”, “is expected”, “anticipates”, “believes”, “plans”, “projects”, “estimates”, “assumes”, “intends”, “strategies”, “targets”, “goals”, “forecasts”, “objectives”, “budgets”, “schedules”, “potential” or variations thereof or stating that certain actions, events or results “may”, “could”, “would”, “might” or “will” be taken, occur or be achieved, or the negative of any of these terms and similar expressions) are not statements of historical fact and may be forward-looking statements or information. Forward-looking statements or information relate to, among other things: the price of silver and other metals; the accuracy of mineral resource and mineral reserve estimates at the Company’s material properties; the sufficiency of the Company’s capital to finance the Company’s operations; estimates of the Company’s revenues and capital expenditures; estimated production from the Company’s mines in the Ying Mining District; timing of receipt of permits and regulatory approvals; availability of funds from production to finance the Company’s operations; and access to and availability of funding for future construction, use of proceeds from any financing and development of the Company’s properties.
Forward-looking statements or information are subject to a variety of known and unknown risks, uncertainties and other factors that could cause actual events or results to differ from those reflected in the forward-looking statements or information, including, without limitation, risks relating to: fluctuating commodity prices; calculation of resources, reserves and mineralization and precious and base metal recovery; interpretations and assumptions of mineral resource and mineral reserve estimates; exploration and development programs; feasibility and engineering reports; permits and licences; title to properties; property interests; joint venture partners; acquisition of commercially mineable mineral rights; financing; recent market events and conditions; economic factors affecting the Company; timing, estimated amount, capital and operating expenditures and economic returns of future production; integration of future acquisitions into the Company’s existing operations; competition; operations and political conditions; regulatory environment in China and Canada; environmental risks; foreign exchange rate fluctuations; insurance; risks and hazards of mining operations; key personnel; conflicts of interest; dependence on management; internal control over financial reporting as per the requirements of the Sarbanes-Oxley Act; and bringing actions and enforcing judgments under U.S. securities laws.
This list is not exhaustive of the factors that may affect any of the Company’s forward-looking statements or information. Forward-looking statements or information are statements about the future and are inherently uncertain, and actual achievements of the Company or other future events or conditions may differ materially from those reflected in the forward-looking statements or information due to a variety of risks, uncertainties and other factors, including, without limitation, those referred to in the Company’s Annual Information Form for the year ended March 31, 2015 under the heading “Risk Factors”. Although the Company has attempted to identify important factors that could cause actual results to differ materially, there may be other factors that cause results not to be as anticipated, estimated, described or intended. Accordingly, readers should not place undue reliance on forward-looking statements or information.
The Company’s forward-looking statements and information are based on the assumptions, beliefs, expectations and opinions of management as of the date of this press release, and other than as required by applicable securities laws, the Company does not assume any obligation to update forward-looking statements and information if circumstances or management’s assumptions, beliefs, expectations or opinions should change, or changes in any other events affecting such statements or information. For the reasons set forth above, investors should not place undue reliance on forward-looking statements and information.