VANCOUVER, British Columbia – August 9, 2018 – Silvercorp Metals Inc. (“Silvercorp” or the “Company”) (TSX: SVM) (NYSE American: SVM) reported its financial and operating results for the first quarter ended June 30, 2018 (“Q1 Fiscal 2019”). All amounts are expressed in US Dollars.
Q1 FISCAL YEAR 2019 HIGHLIGHTS
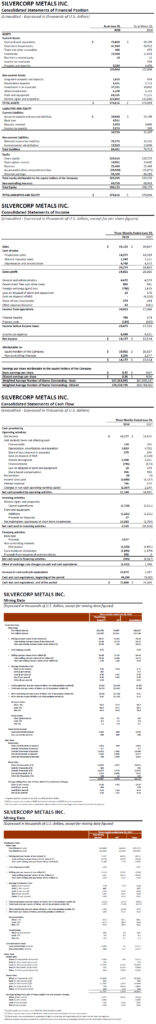
- Sales of $45.1 million, up 14% or $5.4 million compared to $39.7 million in the prior year quarter;
- Net income attributable to equity shareholders of $10.9 million, or $0.07 per share1, an effective increase of $4.3 million or 65% over the prior year quarter, which was $6.6 million or $0.04 per share after excluding a one-time non-cash gain on disposal of NSR, which increased the actual net income attributable to shareholders to $10.9 million or $0.07 per share for that period;
- Gross profit margin of 55% compared with 50% in the prior year quarter;
- Cash flow from operations of $21.1 million, an increase of $4.2 million or 25% compared to $16.9 million in the prior year quarter;
- Silver, lead, and zinc metals sold amounted to approximately 1.5 million ounces silver, 14.9 million pounds lead, and 6.4 million pounds zinc, compared to 1.5 million ounces silver, 15.9 million pounds lead, and 5.0 million pounds zinc in the prior year quarter. The ending inventories of silver-lead concentrate were 5,650 tonnes (containing approximately 0.5 million ounces of silver and 6.2 million pounds of lead), an increase of 39%, compared to 4,070 tonnes of silver-lead concentrate inventories as at March 31, 2018;
- Cash cost per ounce of silver2, net of by-product credits, of negative $7.54, compared to negative $3.57 in the prior year quarter;
- All-in sustaining cost per ounce of silver2, net of by-product credits, of $0.41, compared to $4.70 in the prior year quarter;
- Paid dividend of $2.1 million, or $0.0125 per share, to equity shareholders; and,
- Ended the quarter with $114.8 million in cash and cash equivalents and short-term investments, an increase of $8.7 million or 8% compared to $106.1 million as at March 31, 2018.
FINANCIALS
Net income attributable to equity shareholders of the Company in Q1 Fiscal 2019 was $10.9 million, or basic earnings per share of $0.07, compared to $10.9 million, or $0.07 per share ($6.6 million or $0.04 per share if excluding one-time non-cash gain on disposal of NSR) in Q1 Fiscal 2018.
Sales in Q1 Fiscal 2019 were $45.1 million, up 14% compared to $39.7 million in the prior year quarter. Silver and gold sales represented $19.8 million and $0.7 million, respectively, while base metals represented $24.6 million of total sales compared to silver, gold and base metals sales of $20.2 million, $1.0 million, and $18.6 million, respectively, in the prior year quarter.
The Company’s financial results in Q1 Fiscal 2019 were mainly impacted by the following: i) an increase of 2%, 34%, and 23% in the net realized selling price for silver, lead, and zinc, respectively; ii) slightly less silver and lead sold; and iii) an 8% increase in consolidated cash production costs per tonne of ore processed.
As at June 30, 2018, inventories of silver-lead concentrate were 5,650 tonnes (containing approximately 0.5 million ounces of silver and 6.2 million pounds of lead), an increase of 39% and 37%, respectively, compared to 4,070 tonnes and 4,111 tonnes of silver-lead concentrate inventories as at March 31, 2018 and June 30, 2017, respectively.
Cost of sales in Q1 Fiscal 2019 was $20.3 million compared to $19.7 million in Q1 Fiscal 2018. The cost of sales included $14.3 million cash production costs (Q1 Fiscal 2018 – $14.1 million), $1.2 million mineral resources tax (Q1 Fiscal 2018 – $1.1 million), and $4.7 million depreciation and amortization charges (Q1 Fiscal 2018 – $4.5 million). The cash production costs expensed in cost of sales represent approximately 206,800 tonnes of ore processed and expensed at costs of $69.05 per tonne (Q1 Fiscal 2018 – approximately 221,500 tonnes at $63.70 per tonne)
Gross profit margin in Q1 Fiscal 2019 improved to 55%, compared to 50% in Q1 Fiscal 2018. Ying Mining District’s gross profit margin was 59% compared to a 56% gross profit margin in the prior year quarter, while GC Mine’s gross profit margin was 39% compared to a 30% gross profit margin in the prior year quarter.
General and administrative expenses in Q1 Fiscal 2019 were $4.5 million, a slight decrease compared to $4.6 million in Q1 Fiscal 2018.
Income tax expenses in Q1 Fiscal 2019 were $6.5 million compared to $4.0 million in Q1 Fiscal 2018. The income tax expenses recorded in Q1 Fiscal 2019 included current income tax expenses of $5.9 million (Q1 Fiscal 2018 – $3.2million) and deferred income tax expenses of $0.5 million (Q1 Fiscal 2018 – $0.8 million).
Cash flows provided by operating activities in Q1 Fiscal 2019 were $21.1 million, an increase of $4.2 million or 25%, compared to $16.9 million in the prior year quarter. Before changes in non-cash operating working capital3, cash flows provided by operating activities in Q1 Fiscal 2019 were $23.5 million, an increase of $8.8 million or 60%, compared to $14.7 million in the prior year quarter.
The Company ended the quarter with $114.8 million in cash and short-term investments, an increase of $8.7 million or 8% compared to $106.1 million as at March 31, 2018.
Working capital as at June 30, 2018 was $94.1 million, an increase of $3.6 million or 4%, compared to $90.5 million working capital as at March 31, 2018.
OPERATIONS AND DEVELOPMENT
In Q1 Fiscal 2019, on a consolidated basis, the Company mined 236,697 tonnes of ore, an increase of 5% compared to 225,273 tonnes in Q1 Fiscal 2018. The increase in ore mined was mainly due to an increase of 23% or 15,102 tonnes at the GC Mine, offset by a decrease of 2% or 3,678 tonnes at the Ying Mining District. Ore milled were 237,740 tonnes, up by 3% compared to 230,903 tonnes of ore milled in Q1 Fiscal 2018.
In Q1 Fiscal 2019, the Company sold 1.5 million ounces of silver, 700 ounces of gold, 14.9 million pounds of lead, and 6.4 million pounds of zinc, compared to 1.5 million ounces of silver, 900 ounces of gold, 15.9 million pounds of lead, and 5.0 million pounds of zinc, respectively, in Q1 Fiscal 2018. As at June 30, 2018, inventories of silver-lead concentrate were 5,650 tonnes (containing approximately 0.5 million ounces of silver and 6.2 million pounds of lead), an increase of 39% and 37%, respectively, compared to 4,070 tonnes and 4,111 tonnes of silver-lead concentrate inventories as at March 31, 2018 and June 30, 2017, respectively.
In Q1 Fiscal 2019, the consolidated total mining costs and cash mining costs were $74.39 and $54.47 per tonne, up 9% and 8% compared to $68.12 and $50.29 per tonne, respectively, in Q1 Fiscal 2018, but below the annual guidance the Company announced in February 2018. The increase in cash mining costs compared to Q1 Fiscal 2018 was mainly due to: i) a $0.3 million increase in mining contractor costs as ore mined by the resuing mining method increased by 8% at the Ying Mining District; ii) a $0.4 million increase in mining preparation costs resulting from more underground drilling and preparation tunnelling expensed in the current quarter; iii) a $0.4 million increase in raw material supply costs; and iv) a $0.3 million increase in mining labour costs.
The consolidated total milling costs and cash milling costs in Q1 Fiscal 2019 were $14.16 and $11.73 per tonne, compared to $12.88 and $10.54 per tonne, respectively, in Q1 Fiscal 2018. The increase in cash milling costs was mainly due to a $0.2 million increase in raw material supply costs.
Correspondingly, the consolidated cash production costs per tonne of ore processed in Q1 Fiscal 2019 increased by 8% to $69.05 from $63.70 in the prior year quarter, but below the annual guidance the Company provided in February 2018.
In Q1 Fiscal 2019, the consolidated total production costs and cash costs per ounce of silver, net of by-product credits, were negative $4.29 and negative $7.54 compared to negative $0.62 and negative $3.57 respectively, in the prior year quarter. The overall improvement in cash cost per ounce of silver, net of by-product credits, is mainly due to a 30% increase in by-product credits, mainly arising from a 34% and 23% increase in lead and zinc net realized selling prices. Sales from lead and zinc accounted for 54% of the total sales and amounted to $24.5 million, an increase of $6.4 million, compared to $18.1 million in the prior year quarter.
The consolidated all-in sustaining cost per ounce of silver, net of by-product credits, is $0.41 compared to $4.70 in Q1 Fiscal 2018.
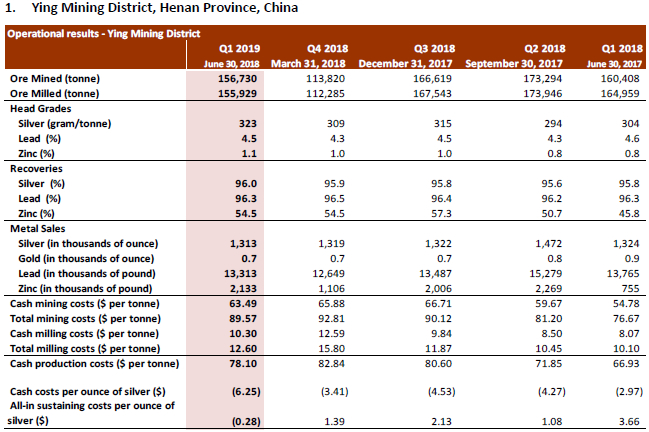
In Q1 Fiscal 2019, the total ore mined at the Ying Mining District was 156,730 tonnes, a decrease of 2%, compared to 160,408 tonnes mined in the prior year quarter. The decrease was mainly due to a tailings leak incident reported on April 16, 2018 resulting in operating activities at the Ying Mining District being interrupted for more than fifteen days.
Head grades were 323 grams per ton (“g/t”) for silver, 4.5% for lead, and 1.1% for zinc, compared to 304 g/t for silver, 4.6% for lead and 0.8% for zinc in the prior year quarter. The Company continues to achieve improvements in dilution control using its “Enterprise Blog” to assist and manage daily operations and the higher grade justified more use of the resuing mining method.
In Q1 Fiscal 2019, the Ying Mining District sold approximately 1.3 million ounces silver, 13.3 million pounds lead, and 2.1 million pounds zinc, compared to 1.3 million ounces silver, 13.8 million pounds lead, and 0.8 million pounds of zinc in the prior year quarter.
As at June 30, 2018, silver-lead concentrate inventories at the Ying Mining District were 5,250 tonnes containing approximately 0.5 million ounces of silver and 6.0 million pounds of lead, an increase of 30% compared to 4,050 tonnes silver-lead concentrate inventories as at March 31, 2018 and June 30, 2017.
Total and cash mining costs per tonne at the Ying Mining District in Q1 Fiscal 2019 were $89.57 and $63.49 per tonne, respectively, compared to $76.67 and $54.78 per tonne in the prior year quarter. The increase in cash mining costs was mainly due to: i) a $0.3 million increase in mining contractor costs as ore mined by the resuing mining method increased by 8%; ii) a $0.1 million increase in mining preparation costs mainly resulting from 4% more preparation tunnelling expensed; iii) a $0.4 million increase in raw material supply costs; and iv) a $0.2 million increase in mining labour costs.
Total and cash milling costs per tonne at the Ying Mining District in Q1 Fiscal 2019 were $12.60 and $10.30, compared to $10.10 and $8.07 in Q1 Fiscal 2018. The increase in cash milling costs was mainly due to: i) a $0.1 million increase in labour costs; ii) a $0.1 million increase in raw material costs; and iii) higher per tonne fixed costs allocation resulting from lower ore milled and the leakage incident.
Correspondingly, cash production cost per tonne of ore processed in Q1 Fiscal 2019 at the Ying Mining District was $78.10, compared to $66.93 in the prior year quarter.
Cash cost per ounce of silver, net of by-product credits, in Q1 Fiscal 2019 at the Ying Mining District, was negative $6.25 compared to negative $2.97 in the prior year quarter. The improvement was mainly due to a $5.1 million or 37% increase in by-product credits offset by the increase in the per tonne cash production costs as discussed above.
All-in sustaining costs per ounce of silver, net of by-product credits, in Q1 Fiscal 2019 at the Ying Mining District was negative $0.28 compared to $3.66 in the prior year quarter. The improvement was mainly due to lower cash cost per ounce of silver as discussed above.
In Q1 Fiscal 2019, approximately 26,849 metres or $0.6 million worth of underground diamond drilling (Q1 Fiscal 2018 – 31,064 metres or $0.7 million) and 5,541 metres or $1.6 million worth of preparation tunnelling (Q1 Fiscal 2018 – 5,337 metres or $1.4 million) were completed and expensed as mining preparation costs at the Ying Mining District. In addition, approximately 16,928 metres or $6.0 million worth of horizontal tunnel, raises, ramps, and declines (Q1 Fiscal 2018 – 18,890 metres or $5.2 million) were completed and capitalized.
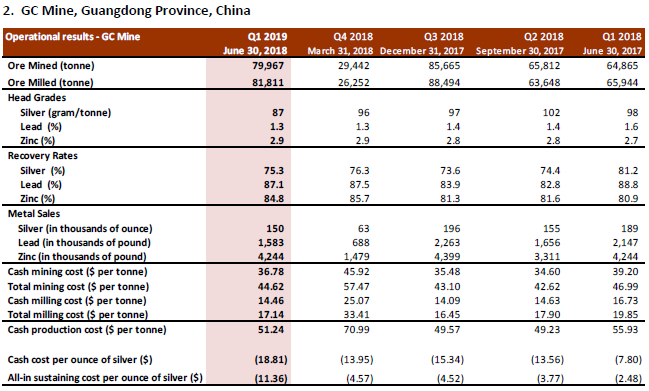
In Q1 Fiscal 2019, the total ore mined at the GC Mine was 79,967 tonnes, an increase of 23% compared to 64,865 tonnes mined in the prior year quarter, while ore milled increased by 24% to 81,811 tonnes from 65,944 tonnes in the prior year quarter. Head grades were 87 g/t for silver, 1.3% for lead, and 2.9% for zinc compared to 98 g/t for silver, 1.6% for lead, and 2.7% for zinc in the prior year quarter.
In Q1 Fiscal 2019, GC Mine sold approximately 150 thousand ounces of silver, 1.6 million pounds of lead, and 4.2 million pounds of zinc, compared to 189 thousand ounces of silver, 2.1 million pounds of lead, and 4.2 million pounds of zinc sold in the prior year quarter.
Total and cash mining costs per tonne at the GC Mine in Q1 Fiscal 2019 were $44.62 and $36.78 per tonne, a decrease of 5% and 6% respectively, compared to $46.99 and $39.20 per tonne in Q1 Fiscal 2018. Total and cash milling costs per tonne at the GC Mine in Q1 Fiscal 2019 were $17.14 and $14.46, compared to $19.85 and $16.73, respectively, in Q1 Fiscal 2018. The decrease in cash mining costs and cash milling costs was mainly due to lower per tonne fixed costs allocation resulting from the increase in ore mined and milled.
The cash production cost per tonne of ore processed in Q1 Fiscal 2019 at the GC Mine was $51.24, a decrease of 8% compared to $55.93 in the prior year quarter.
Cash costs per ounce of silver, net of by-product credits, at the GC Mine, was negative $18.81 compared to negative $7.80 in the prior year quarter. The improvement was mainly due to the 8% improvement in cash production costs per tonne as discussed above and an increase of $0.7 million in by-product credits at the GC Mine.
All in sustaining costs per ounce of silver, net of by-product credits, in Q1 Fiscal 2019 at the GC Mine was negative $11.36 compared to negative $2.48 in the prior year quarter, and the improvement was mainly due to the improvement in the cash costs, per ounce of silver, net of by-product credits as discussed above.
In Q1 Fiscal 2019, approximately 7,999 metres or $0.4 million worth of underground diamond drilling (Q1 Fiscal 2018 – 4,972 metres or $0.3 million) and 5,241 metres or $1.6 million worth of tunnelling (Q1 Fiscal 2018 – 5,292 metres or $1.3 million) were completed and expensed as mining preparation costs at the GC Mine. In addition, approximately 538 metres or $0.5 million worth of horizontal tunnel, raises, ramps and declines (Q1 Fiscal 2018 –158 metres or $0.1 million) were completed and capitalized.
Mr. Guoliang Ma, P.Geo., Manager of Exploration and Resource of the Company, is the Qualified Person for Silvercorp under NI 43-101 and has reviewed and given consent to the technical information contained in this news release.
This earnings release should be read in conjunction with the Company’s Management Discussion & Analysis, Financial Statements and Notes to Financial Statements for the corresponding period, which have been posted on SEDAR under the Company’s profile at www.sedar.com and are also available on the Company’s website at www.silvercorp.ca. All figures are in United States dollars unless otherwise stated.
About Silvercorp
Silvercorp is a low-cost silver-producing Canadian mining company with multiple mines in China. The Company’s vision is to deliver shareholder value by focusing on the acquisition of underdeveloped projects with resource potential and the ability to grow organically. For more information, please visit our website at www.silvercorp.ca.
For further information
Silvercorp Metals Inc.
Lorne Waldman
Senior Vice President
Phone: (604) 669-9397
Toll Free 1(888) 224-1881
Email: investor@silvercorp.ca
Website: www.silvercorp.ca
CAUTIONARY DISCLAIMER – FORWARD-LOOKING STATEMENTS
Certain of the statements and information in this news release constitute “forward-looking statements” within the meaning of the United States Private Securities Litigation Reform Act of 1995 and “forward-looking information” within the meaning of applicable Canadian provincial securities laws (collectively, “forward-looking statements”). Any statements or information that express or involve discussions with respect to predictions, expectations, beliefs, plans, projections, objectives, assumptions or future events or performance (often, but not always, using words or phrases such as “expects”, “is expected”, “anticipates”, “believes”, “plans”, “projects”, “estimates”, “assumes”, “intends”, “strategies”, “targets”, “goals”, “forecasts”, “objectives”, “budgets”, “schedules”, “potential” or variations thereof or stating that certain actions, events or results “may”, “could”, “would”, “might” or “will” be taken, occur or be achieved, or the negative of any of these terms and similar expressions) are not statements of historical fact and may be forward-looking statements. Forward-looking statements relate to, among other things: the price of silver and other metals; the accuracy of mineral resource and mineral reserve estimates at the Company’s material properties; the sufficiency of the Company’s capital to finance the Company’s operations; estimates of the Company’s revenues and capital expenditures; estimated production from the Company’s mines in the Ying Mining District; timing of receipt of permits and regulatory approvals; availability of funds from production to finance the Company’s operations; and access to and availability of funding for future construction, use of proceeds from any financing and development of the Company’s properties.
Forward-looking statements are subject to a variety of known and unknown risks, uncertainties and other factors that could cause actual events or results to differ from those reflected in the forward-looking statements, including, without limitation, risks relating to: fluctuating commodity prices; calculation of resources, reserves and mineralization and precious and base metal recovery; interpretations and assumptions of mineral resource and mineral reserve estimates; exploration and development programs; feasibility and engineering reports; permits and licences; title to properties; property interests; joint venture partners; acquisition of commercially mineable mineral rights; financing; recent market events and conditions; economic factors affecting the Company; timing, estimated amount, capital and operating expenditures and economic returns of future production; integration of future acquisitions into the Company’s existing operations; competition; operations and political conditions; regulatory environment in China and Canada; environmental risks; foreign exchange rate fluctuations; insurance; risks and hazards of mining operations; key personnel; conflicts of interest; dependence on management; internal control over financial reporting; and bringing actions and enforcing judgments under U.S. securities laws.
This list is not exhaustive of the factors that may affect any of the Company’s forward-looking statements. Forward-looking statements are statements about the future and are inherently uncertain, and actual achievements of the Company or other future events or conditions may differ materially from those reflected in the forward-looking statements due to a variety of risks, uncertainties and other factors, including, without limitation, those referred to in the Company’s Annual Information Form for the year ended March 31, 2017 under the heading “Risk Factors”. Although the Company has attempted to identify important factors that could cause actual results to differ materially, there may be other factors that cause results not to be as anticipated, estimated, described or intended. Accordingly, readers should not place undue reliance on forward-looking statements.
The Company’s forward-looking statements are based on the assumptions, beliefs, expectations and opinions of management as of the date of this news release, and other than as required by applicable securities laws, the Company does not assume any obligation to update forward-looking statements if circumstances or management’s assumptions, beliefs, expectations or opinions should change, or changes in any other events affecting such statements. For the reasons set forth above, investors should not place undue reliance on forward-looking statements.