VANCOUVER, British Columbia – May 24, 2018 – Silvercorp Metals Inc. (“Silvercorp” or the “Company”) (TSX: SVM) (NYSE American: SVM) reported its financial and operating results for the fourth quarter and twelve months ended March 31, 2018. All amounts are expressed in US Dollars.
FISCAL YEAR 2018 HIGHLIGHTS
- Net income attributable to equity shareholders of $47.0 million, or $0.28 per share1, up 8% compared to net income attributable to equity shareholders of $43.7 million, or $0.26 per share in the prior year. Adjusted net income attributable to equity shareholders2 of $41.5 million or $0.25 per share after adjustment of impairment reversal and dilution gain, compared to adjusted net income attributable to equity shareholders of $38.6 million or $0.23 per share in the prior year;
- Gross margin of 52% compared with 54% in the prior year;
- Sales of $170.0 million, up 4% compared to $163.5 million in the prior year;
- Silver, lead, and zinc metals sold amounted to approximately 6.0 million ounces of silver, 61.9 million pounds of lead, and 19.6 million pounds of zinc, compared to 6.5 million ounces of silver, 70.5 million pounds of lead, and 18.3 million pounds of zinc in the prior year. The decrease of silver and lead sold was mainly due to silver-lead concentrate inventory built up as inventories of silver-lead concentrate stood at 4,070 tonnes (containing approximately 0.4 million ounces of silver);
- Total and cash mining costs per tonne ore2 of $73.48 and $54.60, respectively, compared to $64.16 and $46.07 in the prior year;
- Cash cost per ounce of silver2, net of by-product credits, of negative $4.73, compared to negative $3.09 in the prior year;
- All-in sustaining cost per ounce of silver2, net of by-product credits, of $3.27, compared to $3.82 in the prior year;
- Spent $4.2 million to buyback 1,717,100 common shares of the Company;
- Paid $3.4 million of dividends to equity shareholders of the Company;
- Invested $23.4 million to participate in a private placement of New Pacific Metals Corp.; and
- Ended the fiscal year with $106.1 million in cash and cash equivalents and short-term investments, an increase of $9.6 million or 10% compared to $96.5 million as at March 31, 2017.
1 Earnings per share refers to basic earnings per share
2 Non IFRS measure, please refer to section 12 of the corresponding MD&A for reconciliation
HIGHLIGHTS FOR THE FOURTH QUARTER FISCAL 2018 (“Q4 FISCAL 2018”)
- Net income attributable to equity shareholders of $12.2 million, or $0.07 per share in Q4 Fiscal 2018, compared to $13.5 million, or $0.08 per share in Q4 Fiscal 2017. The adjusted net income attributable to equity shareholders was $7.5 million, or $0.04 per share in Q4 Fiscal 2018 , after adjustment of impairment reversal of $4.7 million (Q4 Fiscal 2017 – $5.3 million), compared to $8.2 million or $0.05 per share in Q4 Fiscal 2017;
- Gross margin of 50% compared with 60% in the prior year quarter;
- Sales of $38.4 million, up 13% compared to $34.1 million in the prior year quarter;
- Silver, lead, and zinc metals sold amounted to approximately 1.4 million ounces of silver, 13.3 million pounds of lead, and 2.6 million pounds of zinc, compared to 1.3 million ounces of silver, 14.3 million pounds of lead, and 1.5 million pounds of zinc in the prior year quarter;
- Head grades were 309 g/t for silver, 4.3% for lead, and 1.0% for zinc at the Ying Mining District, compared to 298 g/t for silver, 4.8% for lead and 0.8% for zinc in the prior year quarter;
- Total and cash mining costs per tonne ore of $85.55 and $61.78, respectively, compared to $51.37 and $46.82 in the prior year quarter;
- Cash cost per ounce of silver, net of by-product credits, of negative $3.89, compared to negative $3.65 in the prior year quarter;
- All-in sustaining cost per ounce of silver, net of by-product credits, of $3.04, compared to $3.26 in the prior year quarter; and
- Spent $2.4 million to buyback 929,100 common shares of the Company.
FINANCIALS
- Fiscal 2018 vs. Fiscal 2017
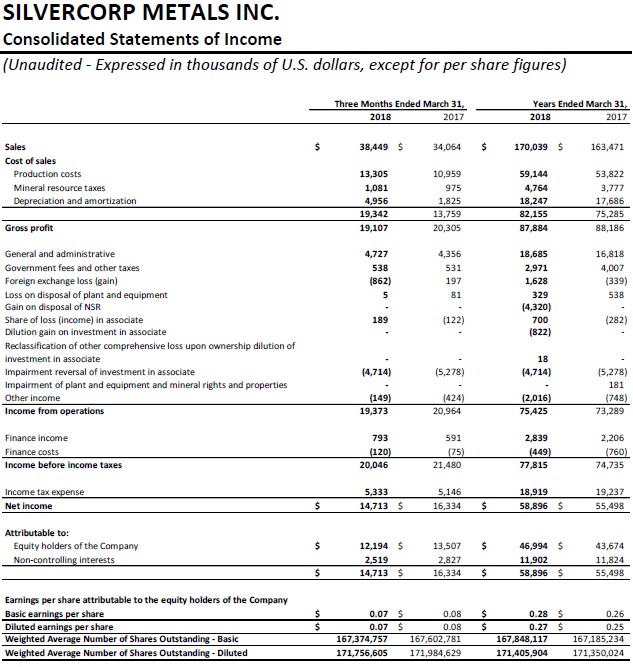
Net income attributable to the shareholders of the Company in Fiscal 2018 was $47.0 million, or $0.28 per share, up 8% compared to $43.7 million, or $0.26 per share in Fiscal 2017. The adjusted net income attributable to the shareholders of the Company was $41.5 million, or $0.25 per share after adjustments of impairment reversal and dilution gain, compared to the adjusted net income of $38.6 million, or $0.23 per share in Fiscal 2017.
Sales in Fiscal 2018 were $170.0 million, up 4% compared to $163.5 million in Fiscal 2017. Silver and gold sales represented $82.4 million and $3.2 million, respectively, while base metals represented $84.5 million of total sales compared to silver, gold and base metal sales of $89.6 million, $3.3 million, and $70.6 million, respectively, in Fiscal 2017.
In Fiscal 2018, the Company’s consolidated financial results were mainly impacted by the following: i) an increase of 25% and 53%, in net realized selling prices for lead and zinc; ii) a decrease of 1% in net realized selling price for silver, iii) less silver and lead sold as inventory built up; and iv) higher per tonne production costs.
As at March 31, 2018, silver-lead concentrate inventories were 4,070 tonnes containing approximately 0.4 million ounces of silver and 4.2 million pounds of lead, an increase of 63% or 1,579 tonnes, compared to 2,491 tonnes silver-lead concentrate inventories containing approximately 0.2 million ounces of silver and 2.8 million pounds of lead held as at March 31, 2017.
Cost of sales in Fiscal 2018 was $82.2 million compared to $75.3 million in Fiscal 2017. The cost of sales included $59.1 million cash production costs (Fiscal 2017 – $53.8 million), $4.8 million mineral resource tax (Fiscal 2017 – $3.8 million), and $18.2 million depreciation, amortization and depletion charges (Fiscal 2017 – $17.7 million).
Gross profit margin in Fiscal 2018 was 52% compared to 54% in Fiscal 2017. Ying Mining District’s gross profit margin was 55% compared to a 57% gross profit margin in the prior year, while GC Mine’s gross profit margin was 36% compared to a 31% gross profit margin in the prior year.
General and administrative expenses in Fiscal 2018 were $18.7 million, an increase of 11% compared to $16.8 million in Fiscal 2017. The increase was mainly due to increased compensation to management and employees and increased costs of administration related to the resumption of activities at the XHP project and the BYP Mine.
Income tax expenses in Fiscal 2018 were $18.9 million, compared to $19.2 million in Fiscal 2017. The income tax expense recorded in Fiscal 2018 included current income tax expense of $16.1 million (Fiscal 2017 – $13.1 million) and deferred income tax expenses of $2.8 million (Fiscal 2017 – $6.1 million).
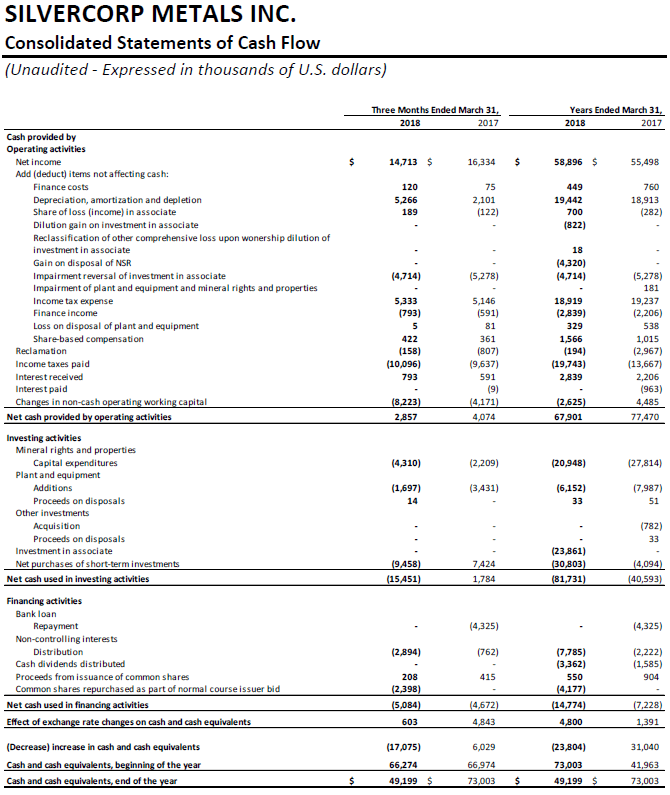
Cash flows provided by operating activities in Fiscal 2018 were $67.9 million, a decrease of $9.6 million or 12%, compared to $77.5 million in the prior year. Before changes in non-cash operating working capital, cash flows provided by operating activities in Fiscal 2018 were $70.5 million, a decrease of $2.5 million or 3%, compared to $73.0 million in the prior year. The decrease was mainly due to increased income taxes paid in Fiscal 2018.
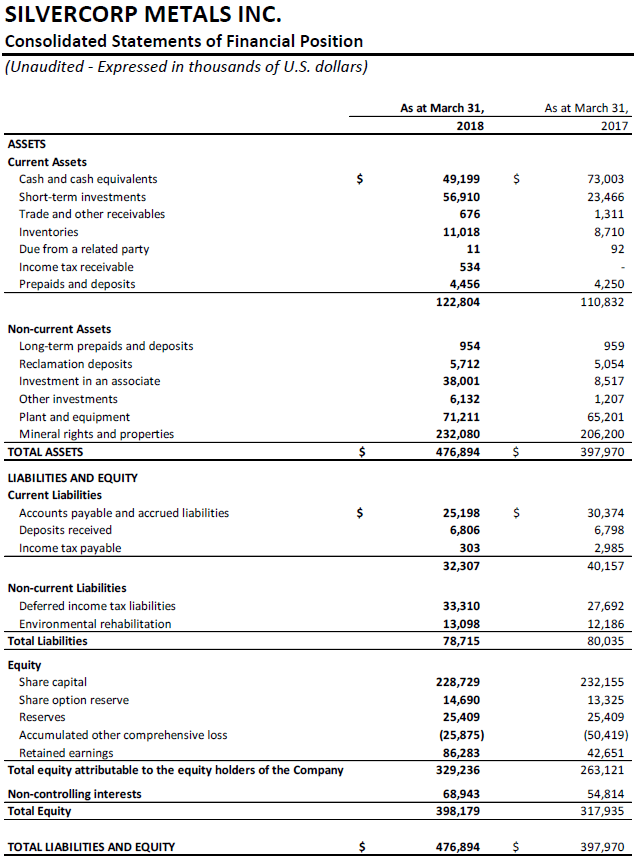
The Company ended the fiscal year with $106.1 million in cash and short term investments, an increase of $9.6 million or 10% compared to $96.5 million as at March 31, 2017.
Working capital as at March 31, 2018 was $90.5 million, an increase of $19.8 million or 28%, compared to $70.7 million working capital as at March 31, 2017.
- Q4 Fiscal 2018 vs. Q4 Fiscal 2017
Net income attributable to equity shareholders of the Company in Q4 Fiscal 2018 was $12.2 million, or $0.07 per share compared to $13.5 million, or $0.08 per share in Q4 Fiscal 2017. The adjusted net income attributable to equity shareholders was $7.5 million, or $0.04 per share in Q4 Fiscal 2018, after adjustment of impairment reversal of $4.7 million (Q4 Fiscal 2017 – $5.3 million), compared to $8.2 million or $0.05 per share in Q4 Fiscal 2017.
The Company’s consolidated financial results in Q4 Fiscal 2018 were mainly impacted by the following: i) an increase of 2%, 16%, and 35% in the net realized selling prices for silver, lead and zinc, respectively, compared to the prior year quarter; ii) an increase of 6% and 74% in silver and zinc sold; and iii) higher per tonne production costs.
Sales in Q4 Fiscal 2018 were $38.4 million, up 13% compared to $34.1 million in Q4 Fiscal 2017. Silver and gold sales represented $19.8 million and $0.8 million, respectively, while base metals represented $17.9 million of total sales compared to silver, gold and base metals of $18.3 million, $0.7 million, and $15.1 million, respectively, in the prior year quarter.
Cost of sales in Q4 Fiscal 2018 was $19.3 million compared to $13.8 million in Q4 Fiscal 2017. The cost of sales included $13.3 million cash production costs (Q4 Fiscal 2017 – $11.0 million), $1.1 million mineral resource taxes (Q4 Fiscal 2017 – $1.0 million), and $5.0 million depreciation, amortization and depletion charges (Q4 Fiscal 2017 – $1.8 million).
Gross profit margin in Q4 Fiscal 2018 decreased to 50%, compared to 60% in Q4 Fiscal 2017.
Cash flows provided by operating activities in Q4 Fiscal 2018 were $2.9 million compared to $4.1 million in Q4 Fiscal 2017. Before changes in non-cash operating working capital, cash flows provided by operating activities in the current quarter were $11.1 million, an increase of $2.9 million, compared to $8.2 million in the prior year quarter.
OPERATIONS AND DEVELOPMENT
- Fiscal 2018 vs. Fiscal 2017
On a consolidated basis, the Company mined 859,924 tonnes of ore in Fiscal 2018, a decrease of 4% or 37,582 tonnes, compared to 897,506 tonnes in Fiscal 2017. Correspondingly, ore milled decreased by 4% or 35,837 tonnes to 863,070 tonnes, compared to 898,907 tonnes in Fiscal 2017. Ore mined at the Ying Mining District decreased by 4% or 22,619 tonnes to 614,141 tonnes from 636,760 tonnes in Fiscal 2017. In Fiscal 2018, at the Ying Mining District, approximately 5,000 tonnes of ore production were affected by the power downtime arising from power grid update work by the State Grid Corporation of China and approximately 15,000 tonnes of ore production were affected by public safety measures, such as explosive supply limitation and temporary suspension of mining activities, brought by the local governments for the 19th National Congress of Communist Party of China.
In Fiscal 2018, the Company sold 6.0 million ounces of silver, 3,100 ounces of gold, 61.9 million pounds of lead, and 19.6 million pounds of zinc, compared to 6.5 million ounces of silver, 3,300 ounces of gold, 70.5 million pounds of lead, and 18.3 million pounds of zinc, respectively, in Fiscal 2017. The decrease of silver and lead sold was mostly due to silver-lead concentrate inventory built up.
The consolidated total mining costs and cash mining costs were $73.48 and $54.60 per tonne, respectively, in Fiscal 2018, an increase of 15% and 19% compared to $64.16 and $46.07 per tonne, respectively, in Fiscal 2017. The increase in cash mining costs were mainly due to: i) a $2.6 million increase in mining preparation costs resulting from more underground tunnelling being expensed in Fiscal 2018, ii) a $2.0 million increase in raw material supply costs, and iii) a $0.6 million increase in mining labor costs.
The consolidated total milling costs and cash milling costs were $13.82 and $11.25 per tonne, respectively, in Fiscal 2018, an increase of 6% and 6% compared to $13.04 and $10.57 per tonne, respectively, in Fiscal 2017. The increase in milling costs was mainly due to a $0.5 million increase in raw material costs.
The consolidated total production costs and cash costs per ounce of silver, net of by-product credits, were negative $1.70 and negative $4.73, respectively, in Fiscal 2018, compared to negative $0.37 and negative $3.09 respectively, in the prior year. The overall improvement in cash cost per ounce of silver, net of by-product credits, is mainly due to a 19% increase in by-product credits, mainly arising from a 25% and 53% increase in lead and zinc realized selling prices, offset by 12% decrease in lead metals sold. Sales from lead and zinc accounted for 49% of the total sales and amounted to $83.7 million, an increase of $13.6 million, compared to $70.1 million in the prior year.
The consolidated all-in sustaining costs per ounce of silver, net of by-product credits, is $3.27 in Fiscal 2018, compared to $3.82 in Fiscal 2017.
- Q4 Fiscal 2018 vs. Q4 Fiscal 2017
The Company mined 143,262 tonnes of ore in Q4 Fiscal 2018, a decrease of 6% or 9,717 tonnes, compared to 152,979 tonnes in Q4 Fiscal 2017. Correspondingly, ore milled decreased by 6% or 9,443 tonnes to 138,537 tonnes, compared to 147,980 tonnes in Q4 Fiscal 2017. Ore mined at the Ying Mining District in Q4 Fiscal 2018 was comparable to the production in the prior year quarter, but ore mined at the GC Mine decreased by 10,782 tonnes.
In Q4 Fiscal 2018, approximately 1.4 million ounces of silver, 700 ounces of gold, 13.3 million pounds of lead, and 2.6 million pounds of zinc were sold compared to 1.3 million ounces of silver, 700 ounces of gold, 14.3 million of lead, and 1.5 million pounds of zinc sold in the prior year quarter.
The consolidated total mining and cash mining costs were $85.55 and $61.78 per tonne, respectively, in Q4 Fiscal 2018, compared to $51.37 and $46.82 per tonne, respectively, in the same prior year period while the consolidated total milling costs and cash milling costs were $19.14 and $14.96 per tonne, respectively, in Q4 Fiscal 2018, compared to $16.68 and $13.03 per tonne, respectively, in Q4 Fiscal 2017.
The consolidated cash production costs and all-in sustaining costs per ounce of silver, net of by-product credits, were negative $3.89 and $3.04, respectively, in Q4 Fiscal 2018, compared to negative $3.65 and $3.26, respectively, in Q4 Fiscal 2017.
- Ying Mining District, Henan Province, China
i) Fiscal 2018 vs. Fiscal 2017
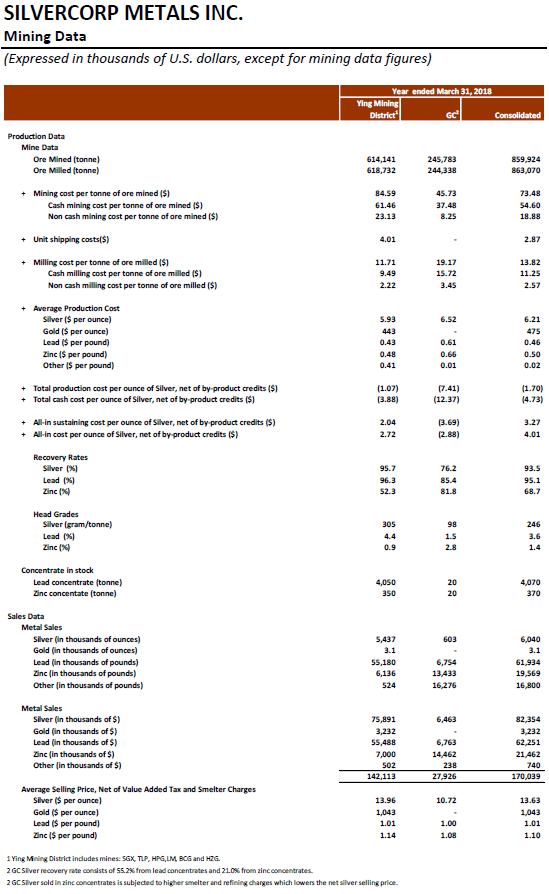
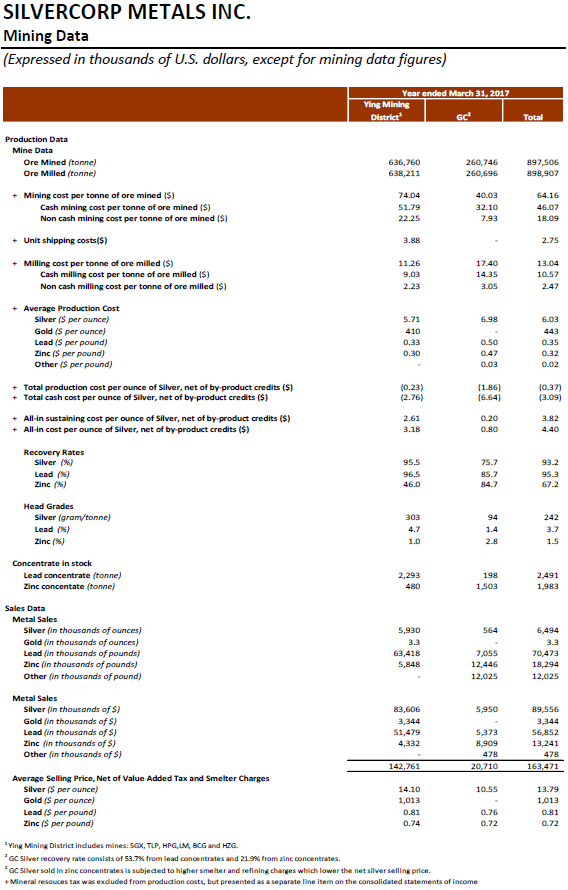
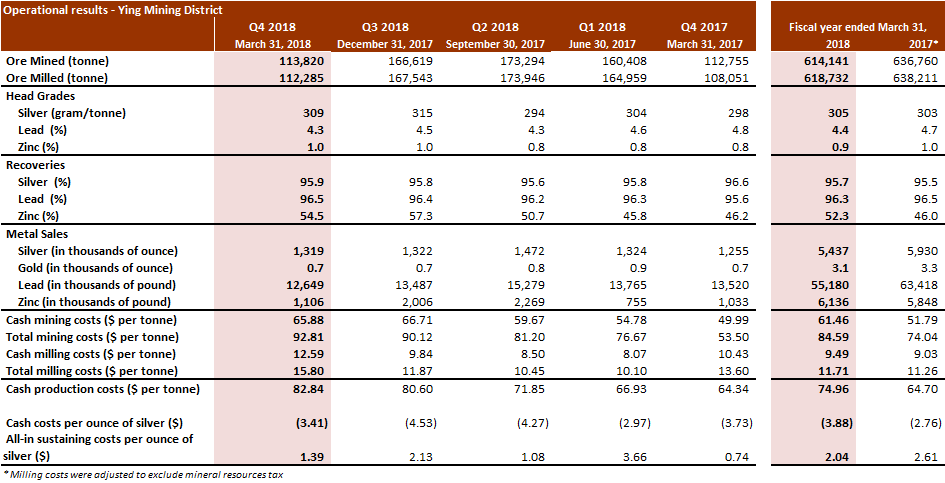
In Fiscal 2018, the total ore mined at the Ying Mining District was 614,141 tonnes, a decrease of 4% or 22,619 tonnes, compared to 636,760 tonnes mined in Fiscal 2017. Correspondingly, ore milled in Fiscal 2018 decreased by 3% to 618,732 tonnes from 638,211 tonnes in the prior year.
Head grades were 305 g/t for silver, 4.4% for lead, and 0.9% for zinc, compared to 303 g/t for silver, 4.7% for lead and 1.0% for zinc in the prior year. The Company continues to achieve improvements in dilution control using its “Enterprise Blog” to manage daily operations.
In Fiscal 2018, the Ying Mining District sold approximately 5.4 million ounces silver, 55.2 million pounds of lead, and 6.1 million pounds of zinc, compared to 5.9 million ounces of silver, 63.4 million pounds of lead, and 5.8 million pounds of zinc in the prior year. The decrease of silver and lead sold was mostly due to silver-lead concentrate inventory built up.
As at March 31, 2018, silver-lead concentrate inventories at the Ying Mining District were 4,050 tonnes containing approximately 0.4 million ounces of silver and 4.2 million pounds of lead, an increase of 77% or 1,757 tonnes, compared to 2,293 tonnes silver-lead concentrate inventories containing approximately 0.2 million ounces of silver and 2.6 million pounds of lead held as at March 31, 2017.
Total and cash mining costs at the Ying Mining District were $84.59 and $61.46 per tonne, respectively, in Fiscal 2018, compared to $74.04 and $51.79 per tonne, respectively, in Fiscal 2017. The increase in cash mining costs were mainly due to: i) a $2.0 million increase in raw material supply costs, ii) a $1.7 million increase in mining preparation costs resulting from more underground drilling and tunnelling being expensed in Fiscal 2018, and iii) a $0.5 million increase in mining labour costs.
Total and cash milling costs at the Ying Mining District were $11.71 and $9.49 per tonne, respectively, in Fiscal 2018, compared to $11.26 and $9.03 per tonne, respectively, in Fiscal 2017. The increase in cash milling costs was mainly due to a 15% increase in raw material supply costs.
Correspondingly, cash production cost per tonne of ore processed in Fiscal 2018 at the Ying Mining District was $74.96, an increase of 16% compared to $64.70 in the prior year.
Cash cost per ounce of silver, net of by-product credits, in Fiscal 2018 at the Ying Mining District, was negative $3.88, compared to negative $2.76 in the prior year.
All-in sustaining costs per ounce of silver, net of by-product credits, in Fiscal 2018 at the Ying Mining District was $2.04 compared to $2.61 in the prior year quarter.
In Fiscal 2018, approximately 104,798 m or $2.3 million of underground diamond drilling (Fiscal 2017 – 93,735 m or $2.1 million) and 19,723 m or $5.8 million of preparation tunnelling (Fiscal 2017 – 17,787 m or $5.0 million) were completed and expensed as mining preparation costs at the Ying Mining District. In addition, approximately 61,827 m or $20.1 million of horizontal tunnels, raises and declines (Fiscal 2017 – 60,241 m or $18.1 million) were completed and capitalized. ii) Q4 Fiscal 2018 vs. Q4 Fiscal 2017
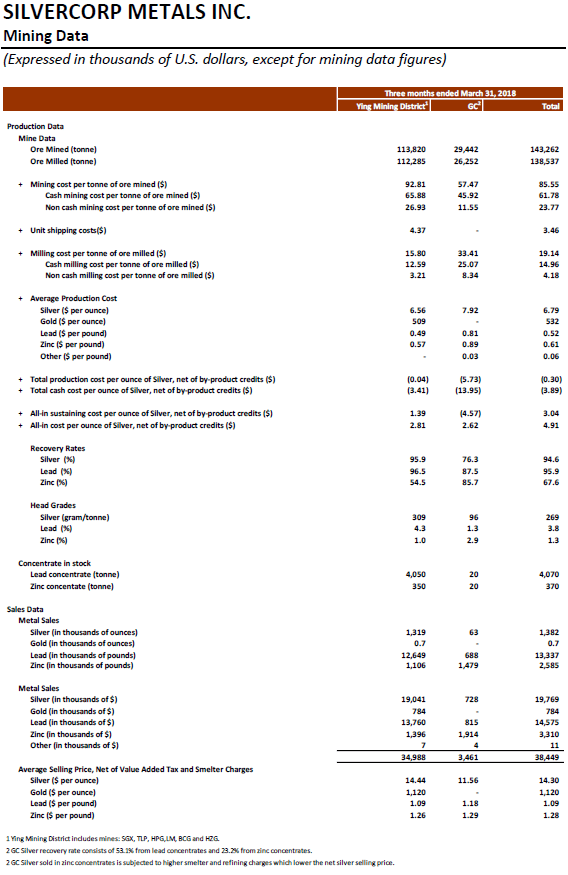
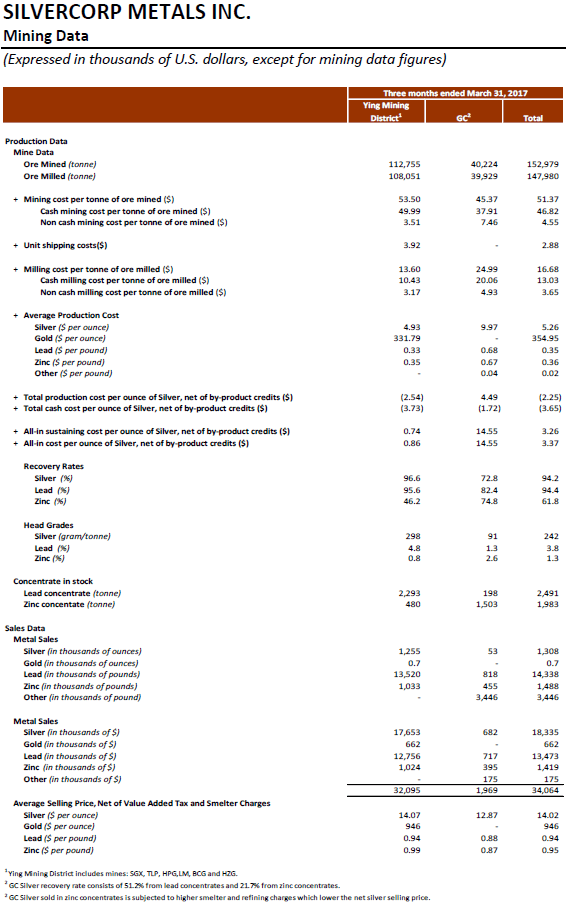
In Q4 Fiscal 2018, a total of 113,820 tonnes of ore were mined and 112,285 tonnes milled at the Ying Mining District, up by 1% and 4%, compared to 112,755 tonnes mined and 108,051 tonnes milled in Q4 Fiscal 2017.
Average head grades were 309 g/t for silver, 4.3% for lead, and 1.0% for zinc compared to 298 g/t for silver, 4.8% for lead, and 0.8% for zinc, respectively, in the Q4 Fiscal 2017.
Metals sold were approximately 1.3 million ounces of silver, 700 ounces of gold, 12.6 million pounds of lead, and 1.1 million pounds of zinc, compared to 1.3 million ounces of silver, 700 ounces of gold, 13.5 million pounds of lead, and 1.0 million pounds of zinc in Q4 Fiscal 2017.
The cash mining costs at the Ying Mining District in Q4 Fiscal 2018 was $65.88 per tonne, compared to $49.99 in Q4 Fiscal 2017. The increase in cash mining costs were mainly due to: i) a $0.3 million increase in raw material supply costs, ii) a $0.4 million increase in mining preparation costs, and iii) a $0.7 million increase in direct mining contractor costs.
The cash milling cost was $12.59 per tonne in Q4 Fiscal 2018, an increase of 21% compared to $10.43 in Q4 Fiscal 2017.
Cash cost per ounce of silver and all-in sustaining costs per ounce of silver, net of by‐product credits, at the Ying Mining District, for Q4 Fiscal 2018, were negative $3.41 and $1.39, respectively, compared to negative $3.73 and $0.74, respectively, in Q4 Fiscal 2017.
In Q4 Fiscal 2018, approximately 18,791 m or $0.6 million of underground diamond drilling (Q4 Fiscal 2017 – 21,961 m or $0.4 million) and 2,809 m or $0.9 million of preparation tunnelling (Q4 Fiscal 2017 – 2,718 m or $0.8 million) were completed and expensed as mining preparation costs at the Ying Mining District. In addition, approximately 9,653 m or $3.9 million of horizontal tunnels, raises, and declines (Q4 Fiscal 2017 – 9,741 m or $2.9 million) were completed and capitalized.
4. GC Mine, Guangdong Province, China
i) Fiscal 2018 vs. Fiscal 2017
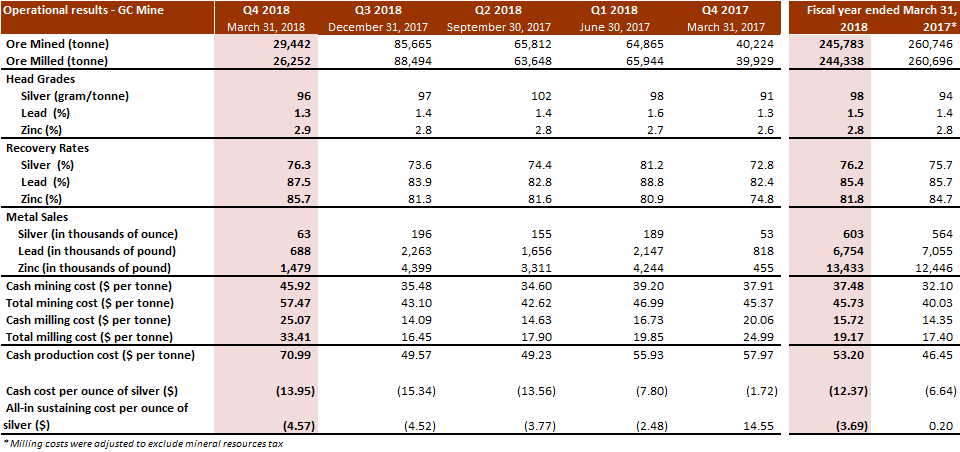
The total ore mined at the GC Mine was 245,783 tonnes, a decrease of 14,963 tonnes or 6%, in Fiscal 2018, compared to 260,746 tonnes mined in Fiscal 2017, while ore milled decreased by 6% to 244,338 tonnes from 260,696 tonnes in the prior year. The decrease of ore mined at the GC Mine was mainly due to the impact arising from a changeover of a mining contractor and lack of skilled miners in the fourth quarter of Fiscal 2018.
Head grades were 98 g/t for silver, 1.5% for lead, and 2.8% for zinc in Fiscal 2018, compared to 94 g/t for silver, 1.4% for lead, and 2.8% for zinc in the prior year.
The GC Mine sold 603,000 ounces of silver, 6.8 million pounds of lead, and 13.4 million pounds of zinc in Fiscal 2018, compared to 564,000 ounces of silver, 7.1 million pounds of lead, and 12.4 million pounds of zinc sold in Fiscal 2017.
Total and cash mining costs at the GC Mine were $45.73 and $37.48 per tonne, respectively, in Fiscal 2018, compared to $40.03 and $32.10 per tonne, respectively, in Fiscal 2017. The increase in cash mining costs was mainly due to a $0.9 million increase in mining preparation costs resulting from more underground drilling expensed in Fiscal 2018.
Total and cash milling costs at the GC Mine were $19.17 and $15.72 per tonne, respectively, in Fiscal 2018, compared to $17.40 and $14.35 per tonne, respectively, in Fiscal 2017. The increase in milling costs was mainly due to higher raw material supply costs.
Correspondingly, cash production costs per tonne of ore processed in Fiscal 2018 at the GC Mine increased by 14% to $53.20 from $46.45 in the prior year due to the increase in both per tonne cash mining and milling costs.
Cash costs per ounce of silver, net of by-product credits, at the GC Mine, was negative $12.37 in Fiscal 2018, compared to negative $6.64 in the prior year. The improvement was mainly due to a 45% increase in by-product credits, mainly arising from an 8% increase in zinc sold and a 32% and 50% increase in net realized lead and zinc selling prices, offset by a 4% decrease in lead sold. Sales from lead and zinc accounted for 76% of the total sales at the GC Mine in Fiscal 2018, and amounted to $21.2 million, an increase of $6.9 million, compared to $14.3 million in the prior year.
All-in sustaining costs per ounce of silver, net of by-product credits, in Fiscal 2018 at the GC Mine was negative $3.69 compared to $0.20 in the prior year. The improvement was mainly due to higher by-product credits achieved as discussed above.
In Fiscal 2018, approximately 21,717 m or $1.1 million of underground diamond drilling (Fiscal 2017 – 12,484 m or $0.8 million) and 15,811 m or $4.5 million of tunnelling (Fiscal 2017 – 14,690 m or $4.0 million) were completed and expensed as mining preparation costs at the GC Mine. In addition, approximately 320 m or $0.3 million of horizontal tunnels, raises and declines (Fiscal 2017 – 1,721 m or $0.7 million) were completed and capitalized. ii) Q4 Fiscal 2018 vs. Q4 Fiscal 2017
In Q4 Fiscal 2018, a total of 29,442 tonnes of ore were mined and 26,252 tonnes were milled at the GC Mine compared to 40,224 tonnes mined and 39,929 tonnes milled in Q4 Fiscal 2017.
Average head grades were 96 g/t for silver, 1.3% for lead, and 2.9% for zinc compared to 91 g/t for silver, 1.3% for lead, and 2.6% for zinc, respectively, in Q4 Fiscal 2017.
Metals sold were approximately 63,000 ounces of silver, 0.7 million pounds of lead, and 1.5 million pounds of zinc, compared to 53,000 ounces of silver, 0.8 million pounds of lead, and 0.5 million pounds of zinc in Q4 Fiscal 2017.
The cash mining costs at the GC Mine was $45.92 per tonne, an increase of 21%, in Q4 Fiscal 2018, compared to $37.91 per tonne in Q4 Fiscal 2017. The increase in cash mining costs was mainly due to lower production output resulting in higher unit costs allocation.
Correspondingly, the cash milling costs at the GC Mine in Q4 Fiscal 2018 increased by 25% to $25.07 per tonne, compared to $20.06 per tonne in Q4 Fiscal 2017.
Cash costs per ounce of silver and all-in sustaining costs per ounce of silver, net of by‐product credits, at the GC Mine, in Q4 Fiscal 2018, were negative $13.95 and negative $4.57, respectively, compared to negative $1.72 and $14.55 in Q4 Fiscal 2017. The improvement is mainly due to higher by-product credits achieved arising from a 225% increase in zinc metal sold along with a 34% and 48% increase, respectively, in lead and zinc realized selling prices.
In Q4 Fiscal 2018, approximately 3,464 m or $0.2 million of underground diamond drilling (Q4 Fiscal 2017 – 2,995 m or $0.2 million) and 1,526 m or $0.7 million of tunnelling (Q4 Fiscal 2017 – 2,714 m or $0.8 million) were completed and expensed as mining preparation costs at the GC Mine. In addition, approximately 40 m or $0.1 million of horizontal tunnels, raises, and declines (Q4 Fiscal 2017 – 40 m or $0.1 million) were completed and capitalized.
Full Milling Operations Resumed at Ying
As announced on April 16, milling operations at the Ying Mining District were temporarily suspended due to a spillage incident. On April 28, one floatation line of 1,000 tonnes per day at the No. 2 mill, using the No. 1 tailing storage facility resumed operation. On May 23, the No. 2 tailing storage facility resumed usage after the fifth overflow well was permanently plugged, and full mill operations resumed.
Mr. Guoliang Ma, P.Geo., Manager of Exploration and Resource of the Company, is the Qualified Person for Silvercorp under NI 43-101 and has reviewed and given consent to the technical information contained in this news release.
This earnings release should be read in conjunction with the Company’s Management Discussion & Analysis, Financial Statements and Notes to Financial Statements for the corresponding period, which have been posted on SEDAR under the Company’s profile at www.sedar.com and are also available on the Company’s website at www.silvercorp.ca. All figures are in United States dollars unless otherwise stated.
About Silvercorp
Silvercorp is a low-cost silver-producing Canadian mining company with multiple mines in China. The Company’s vision is to deliver shareholder value by focusing on the acquisition of underdeveloped projects with resource potential and the ability to grow organically. For more information, please visit our website at www.silvercorp.ca.
For further information
Silvercorp Metals Inc.
Lorne Waldman
Senior Vice President
Phone: (604) 669-9397
Toll Free 1(888) 224-1881
Email: investor@silvercorp.ca
Website: www.silvercorp.ca
CAUTIONARY DISCLAIMER – FORWARD-LOOKING STATEMENTS
Certain of the statements and information in this news release constitute “forward-looking statements” within the meaning of the United States Private Securities Litigation Reform Act of 1995 and “forward-looking information” within the meaning of applicable Canadian provincial securities laws (collectively, “forward-looking statements”). Any statements or information that express or involve discussions with respect to predictions, expectations, beliefs, plans, projections, objectives, assumptions or future events or performance (often, but not always, using words or phrases such as “expects”, “is expected”, “anticipates”, “believes”, “plans”, “projects”, “estimates”, “assumes”, “intends”, “strategies”, “targets”, “goals”, “forecasts”, “objectives”, “budgets”, “schedules”, “potential” or variations thereof or stating that certain actions, events or results “may”, “could”, “would”, “might” or “will” be taken, occur or be achieved, or the negative of any of these terms and similar expressions) are not statements of historical fact and may be forward-looking statements. Forward-looking statements relate to, among other things: the price of silver and other metals; the accuracy of mineral resource and mineral reserve estimates at the Company’s material properties; the sufficiency of the Company’s capital to finance the Company’s operations; estimates of the Company’s revenues and capital expenditures; estimated production from the Company’s mines in the Ying Mining District; timing of receipt of permits and regulatory approvals; availability of funds from production to finance the Company’s operations; and access to and availability of funding for future construction, use of proceeds from any financing and development of the Company’s properties.
Forward-looking statements are subject to a variety of known and unknown risks, uncertainties and other factors that could cause actual events or results to differ from those reflected in the forward-looking statements, including, without limitation, risks relating to: fluctuating commodity prices; calculation of resources, reserves and mineralization and precious and base metal recovery; interpretations and assumptions of mineral resource and mineral reserve estimates; exploration and development programs; feasibility and engineering reports; permits and licences; title to properties; property interests; joint venture partners; acquisition of commercially mineable mineral rights; financing; recent market events and conditions; economic factors affecting the Company; timing, estimated amount, capital and operating expenditures and economic returns of future production; integration of future acquisitions into the Company’s existing operations; competition; operations and political conditions; regulatory environment in China and Canada; environmental risks; foreign exchange rate fluctuations; insurance; risks and hazards of mining operations; key personnel; conflicts of interest; dependence on management; internal control over financial reporting; and bringing actions and enforcing judgments under U.S. securities laws.
This list is not exhaustive of the factors that may affect any of the Company’s forward-looking statements. Forward-looking statements are statements about the future and are inherently uncertain, and actual achievements of the Company or other future events or conditions may differ materially from those reflected in the forward-looking statements due to a variety of risks, uncertainties and other factors, including, without limitation, those referred to in the Company’s Annual Information Form for the year ended March 31, 2017 under the heading “Risk Factors”. Although the Company has attempted to identify important factors that could cause actual results to differ materially, there may be other factors that cause results not to be as anticipated, estimated, described or intended. Accordingly, readers should not place undue reliance on forward-looking statements.
The Company’s forward-looking statements are based on the assumptions, beliefs, expectations and opinions of management as of the date of this news release, and other than as required by applicable securities laws, the Company does not assume any obligation to update forward-looking statements if circumstances or management’s assumptions, beliefs, expectations or opinions should change, or changes in any other events affecting such statements. For the reasons set forth above, investors should not place undue reliance on forward-looking statements.